


Legenda dalam pasukan InstaSpot!
Legenda! Anda fikir ia adalah satu retorik yang besar? Tetapi bagaimana untuk kita memanggil seorang lelaki, yang telah menjadi pemain Asia pertama yang memenangi kejohanan catur dunia junior pada usia 18 tahun dan menjadi Grandmaster India pertama pada usia 19 tahun? Itulah permulaan yang sukar untuk merangkul gelaran Juara Dunia untuk Viswanathan Anand, seorang juara yang telah menjadi sebahagian daripada sejarah catur. Kini satu lagi legenda dalam pasukan InstaSpot!


Borussia adalah salah satu kelab bola sepak paling terkemuka di Jerman, yang telah berulang kali membuktikan kepada peminatnya: semangat persaingan dan kepemimpinan pasti akan membawa kepada kejayaan. Berdagang dengan cara yang sama seperti atlet sukan profesional beraksi menentang lawan: yakin dan aktif. Simpan "hantaran" dari Borussia FC dan menjadi pedagang hebat dengan InstaSpot!

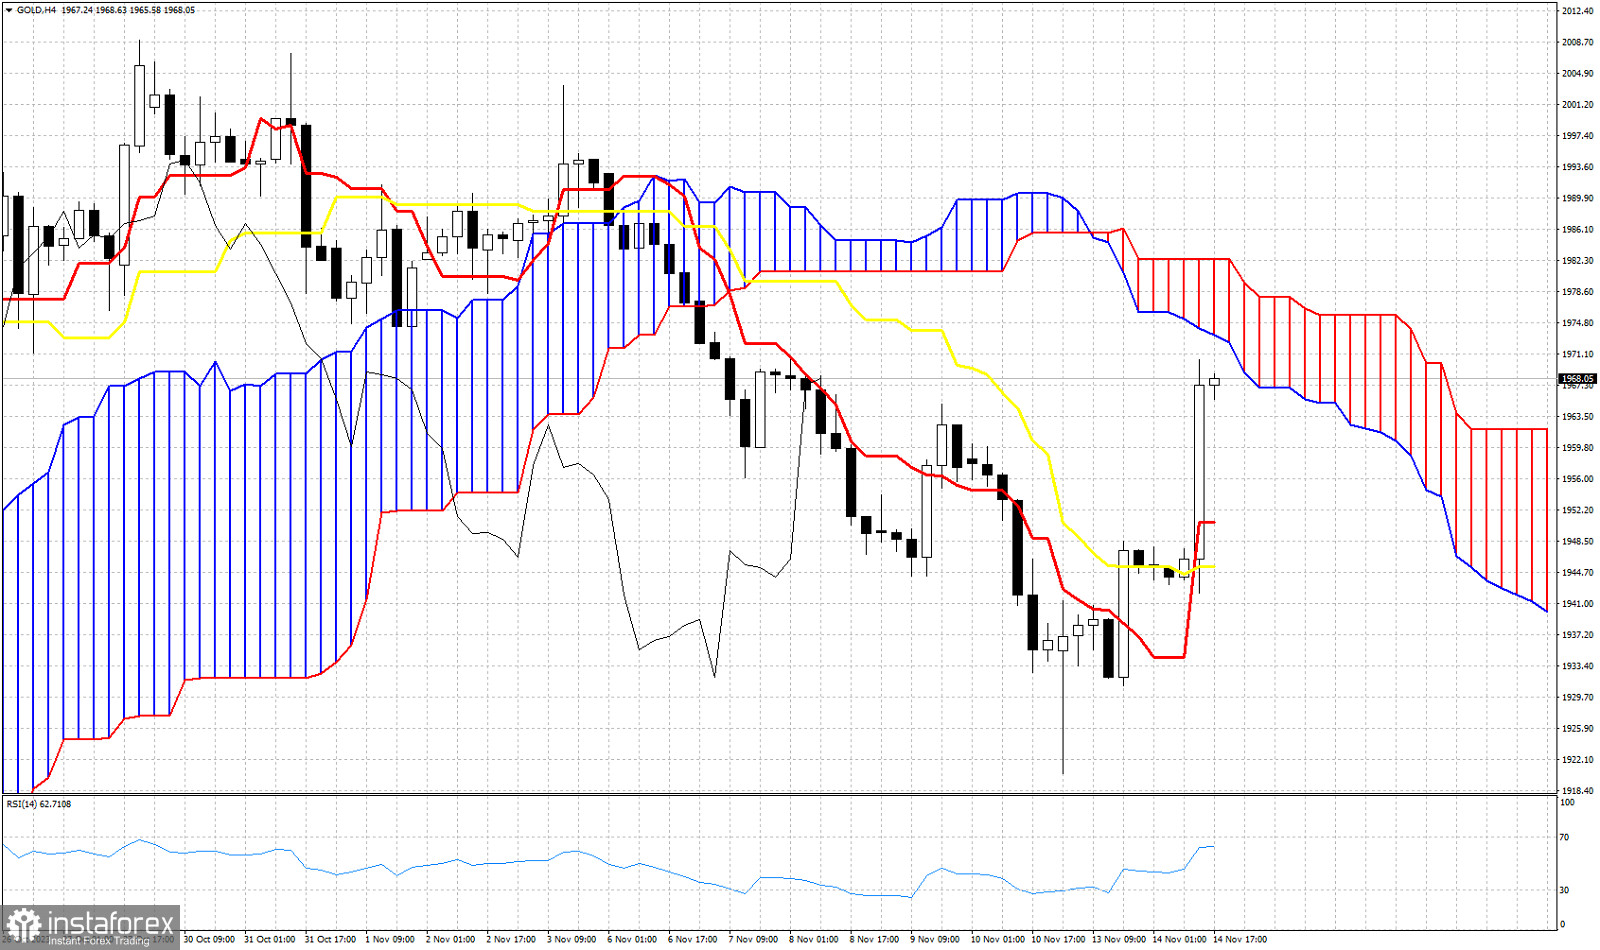
In our technical analysis on Gold yesterday we noted that price had already tested the 38% Fibonacci retracement level and that there were signs of strength as the short-term pull back target has been achieved. Today we use the Ichimoku cloud indicator to identify key support and resistance levels. According to the Ichimoku cloud indicator, trend is still bearish in the 4 hour chart as price remains below the Kumo (cloud). At $1,974 we have the lower cloud boundary. This is the first important resistance in the near term. The Chikou span (black line indicator) is trying to break above the candlestick pattern. It is expected over the next couple of candlesticks for Chikou span to turn bullish. The tenkan-sen (red line indicator) provides support at $1,950 and the kijun-sen (yellow line indicator) at $1,945. As long as we trade above these two indicators, short-term momentum remains bullish and bulls have hopes of breaking above the cloud. Yesterday we noted that technical resistance is at $1,980. Today's strong bounce is an important win for bulls, but they must show more signs of strength in order to hope for a bigger bounce above $2,000.
* Analisis pasaran yang disiarkan di sini adalah bertujuan untuk meningkatkan kesedaran anda, tetapi tidak untuk memberi arahan untuk membuat perdagangan.
Kajian analisis InstaSpot akan membuat anda mengetahui sepenuhnya aliran pasaran! Sebagai pelanggan InstaSpot, anda disediakan sejumlah besar perkhidmatan percuma untuk dagangan yang cekap.


