


Kumpulan kami mempunyai lebih daripada 7,000,000 pedagang!
Setiap hari kami bekerjasama untuk meningkatkan perdagangan. Kami mendapat keputusan yang tinggi dan bergerak ke hadapan.
Pengiktirafan oleh berjuta-juta pedagang di seluruh dunia adalah penghargaan terbaik untuk kerja kami! Anda membuat pilihan anda dan kami akan melakukan segalanya yang diperlukan untuk memenuhi jangkaan anda!
Kami adalah kumpulan yang terbaik bersama!
InstaSpot. Berbangga bekerja untuk anda!


Pelakon, juara kejohanan UFC 6 dan seorang wira sebenar!
Lelaki yang membuat dirinya sendiri. Lelaki yang mengikut cara kami.
Rahsia di sebalik kejayaan Taktarov adalah pergerakan berterusan ke arah matlamat.
Dedahkan semua segi bakat anda!
Cari, cuba, gagal - tetapi tidak pernah berhenti!
InstaSpot. Kisah kejayaan anda bermula di sini!

Trend analysis:
GBP/USD will probably move upward in June, starting from the closing of the May monthly candle at 1.2437 to the upper limit of the Bollinger Bands indicator at 1.3016 (black dashed line). The pair could shift into a downward movement upon reaching this price.
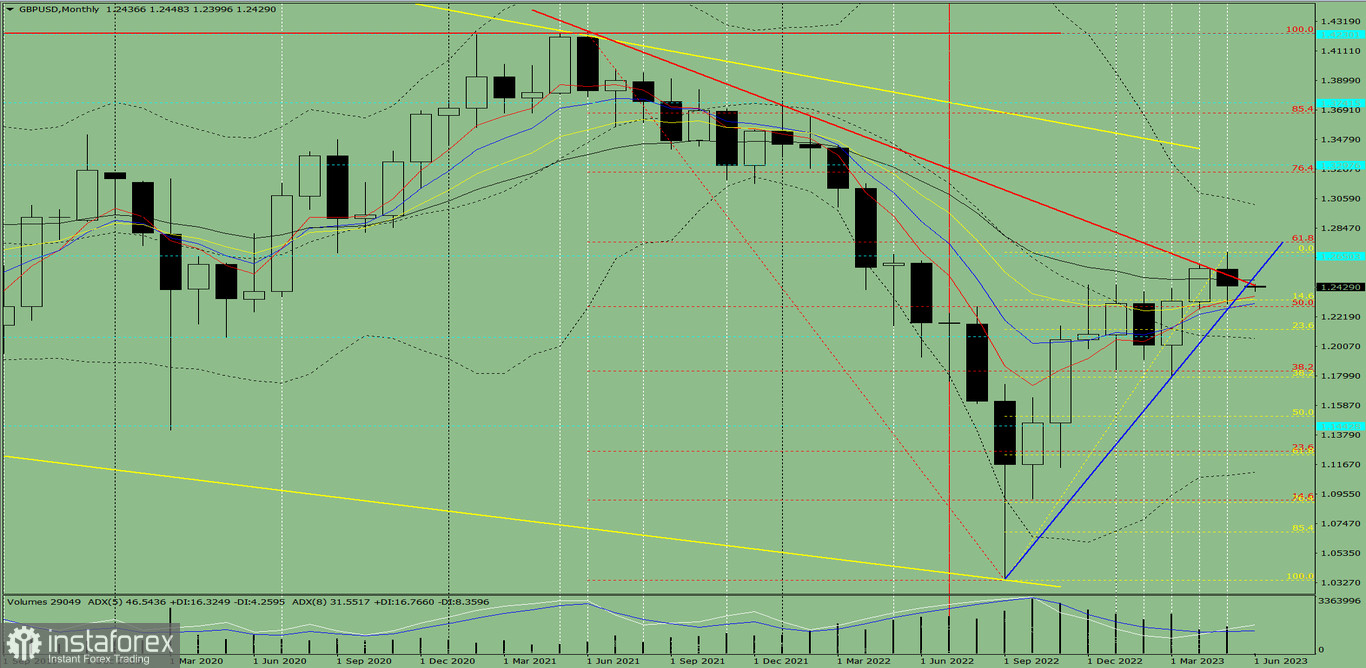
Fig. 1 (monthly chart)
Comprehensive analysis:
Indicator analysis - uptrend
Fibonacci levels - uptrend
Volumes - downtrend
Candlestick analysis - uptrend
Trend analysis - uptrend
Bollinger bands - uptrend
The indicators show that a bullish scenario will unfold in GBP/USD.
Conclusion: The pair will have an upward trend, with a first lower shadow on the monthly white candle (the first week of the month is black) and no second upper shadow (the last week is white).
So, throughout the month, pound will rise from 1.2437 (closing of the May monthly candle) to the upper limit of the Bollinger Bands indicator at 1.3016 (black dashed line), and then turn around and move downwards.
Alternatively, the quotes could climb from 1.2437 (closing of the May monthly candle) to the 61.8% retracement level at 1.2748 (red dashed line), and then bounce down to the 14.6% retracement level at 1.2336 (yellow dashed line).
* Analisis pasaran yang disiarkan di sini adalah bertujuan untuk meningkatkan kesedaran anda, tetapi tidak untuk memberi arahan untuk membuat perdagangan.
Kajian analisis InstaSpot akan membuat anda mengetahui sepenuhnya aliran pasaran! Sebagai pelanggan InstaSpot, anda disediakan sejumlah besar perkhidmatan percuma untuk dagangan yang cekap.


