


Legenda dalam pasukan InstaSpot!
Legenda! Anda fikir ia adalah satu retorik yang besar? Tetapi bagaimana untuk kita memanggil seorang lelaki, yang telah menjadi pemain Asia pertama yang memenangi kejohanan catur dunia junior pada usia 18 tahun dan menjadi Grandmaster India pertama pada usia 19 tahun? Itulah permulaan yang sukar untuk merangkul gelaran Juara Dunia untuk Viswanathan Anand, seorang juara yang telah menjadi sebahagian daripada sejarah catur. Kini satu lagi legenda dalam pasukan InstaSpot!


Borussia adalah salah satu kelab bola sepak paling terkemuka di Jerman, yang telah berulang kali membuktikan kepada peminatnya: semangat persaingan dan kepemimpinan pasti akan membawa kepada kejayaan. Berdagang dengan cara yang sama seperti atlet sukan profesional beraksi menentang lawan: yakin dan aktif. Simpan "hantaran" dari Borussia FC dan menjadi pedagang hebat dengan InstaSpot!

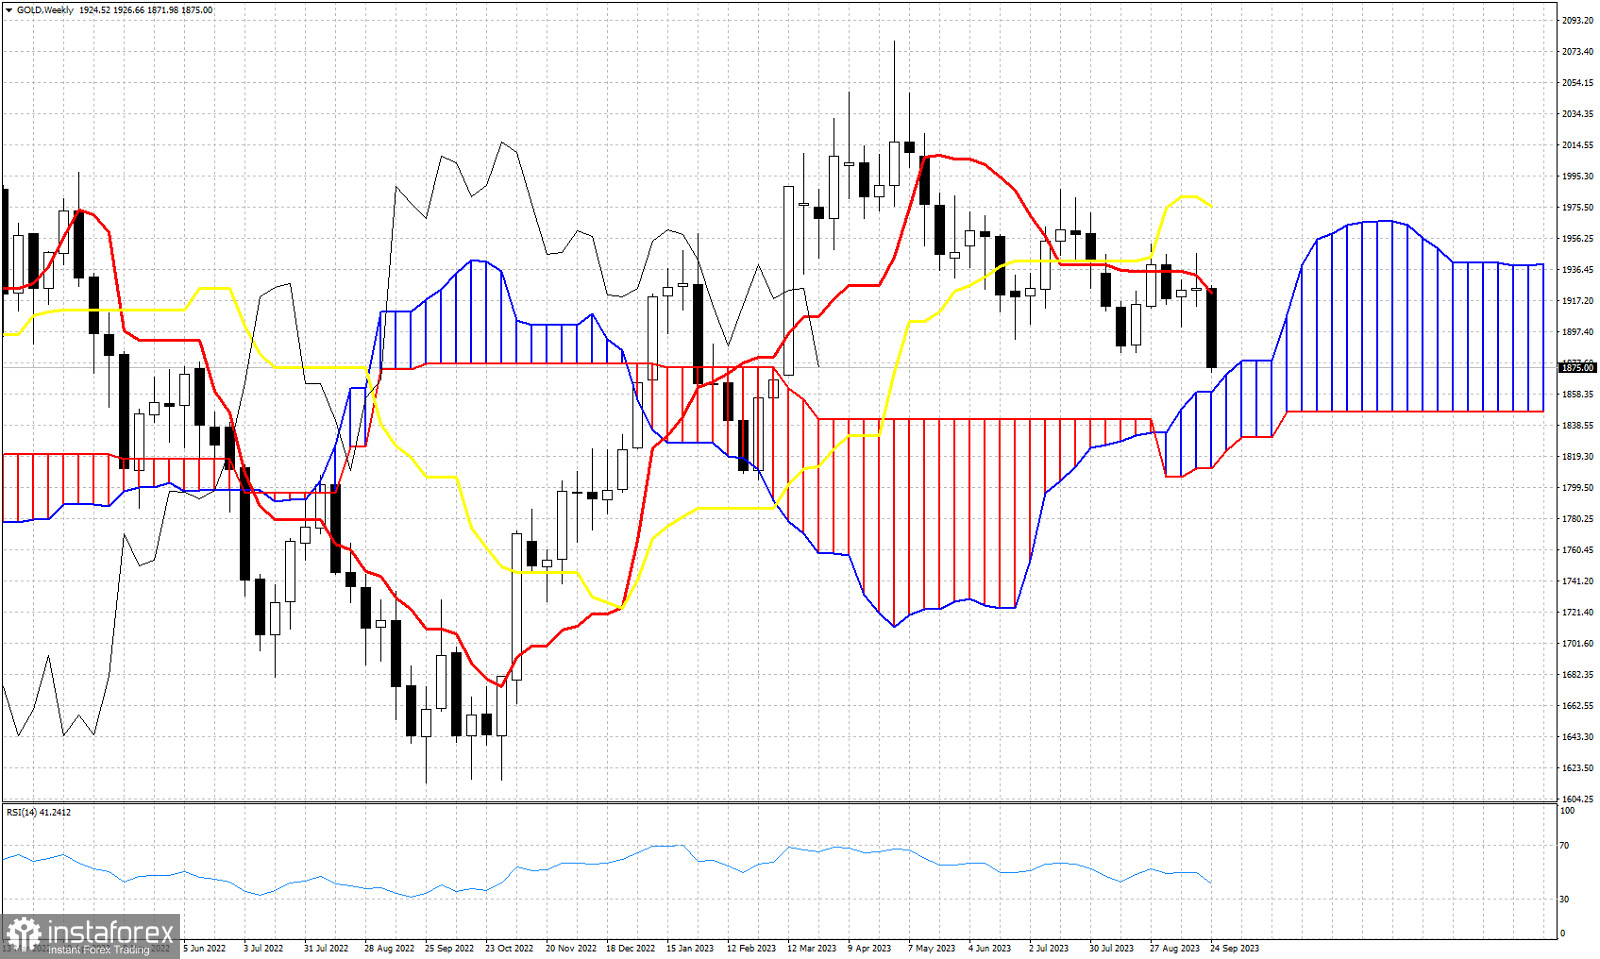
Gold price is making new lows relative to August. Short-term trend remains bearish as we explained in previous posts. Today we take a look at the weekly chart with the use of the Ichimoku cloud indicator. The Chikou span (black line indicator) has just crossed below the candlestick pattern (bearish). Price is trading below both the tenkan-sen (red line indicator) and the kijun-sen (yellow line indicator). However price remains above the Weekly Kumo (cloud). Support by the weekly cloud is found at $1,860. In our previous analysis we noted that we expect Gold price to form a bottom around this area. Using the Ichimoku cloud indicator we confirm the presence of support area around $1,850-60. Gold price remains vulnerable to the downside and bulls do not want to see price enter the Kumo. This will change weekly trend to neutral. Bulls want to see price bounce off the cloud support by forming a higher low and then take out the resistance around $1,925.
* Analisis pasaran yang disiarkan di sini adalah bertujuan untuk meningkatkan kesedaran anda, tetapi tidak untuk memberi arahan untuk membuat perdagangan.
Kajian analisis InstaSpot akan membuat anda mengetahui sepenuhnya aliran pasaran! Sebagai pelanggan InstaSpot, anda disediakan sejumlah besar perkhidmatan percuma untuk dagangan yang cekap.


