


Legenda dalam pasukan InstaSpot!
Legenda! Anda fikir ia adalah satu retorik yang besar? Tetapi bagaimana untuk kita memanggil seorang lelaki, yang telah menjadi pemain Asia pertama yang memenangi kejohanan catur dunia junior pada usia 18 tahun dan menjadi Grandmaster India pertama pada usia 19 tahun? Itulah permulaan yang sukar untuk merangkul gelaran Juara Dunia untuk Viswanathan Anand, seorang juara yang telah menjadi sebahagian daripada sejarah catur. Kini satu lagi legenda dalam pasukan InstaSpot!


Borussia adalah salah satu kelab bola sepak paling terkemuka di Jerman, yang telah berulang kali membuktikan kepada peminatnya: semangat persaingan dan kepemimpinan pasti akan membawa kepada kejayaan. Berdagang dengan cara yang sama seperti atlet sukan profesional beraksi menentang lawan: yakin dan aktif. Simpan "hantaran" dari Borussia FC dan menjadi pedagang hebat dengan InstaSpot!

Details of the economic calendar on April 10
Germany, France, Spain, Italy, Switzerland and the UK had a day off in connection with the celebration of Easter. However, this did not lead to low activity in the financial markets.
Meanwhile, United States resumed work day after a three-day holiday, but important statistics were not released.
Analysis of trading charts from April 10
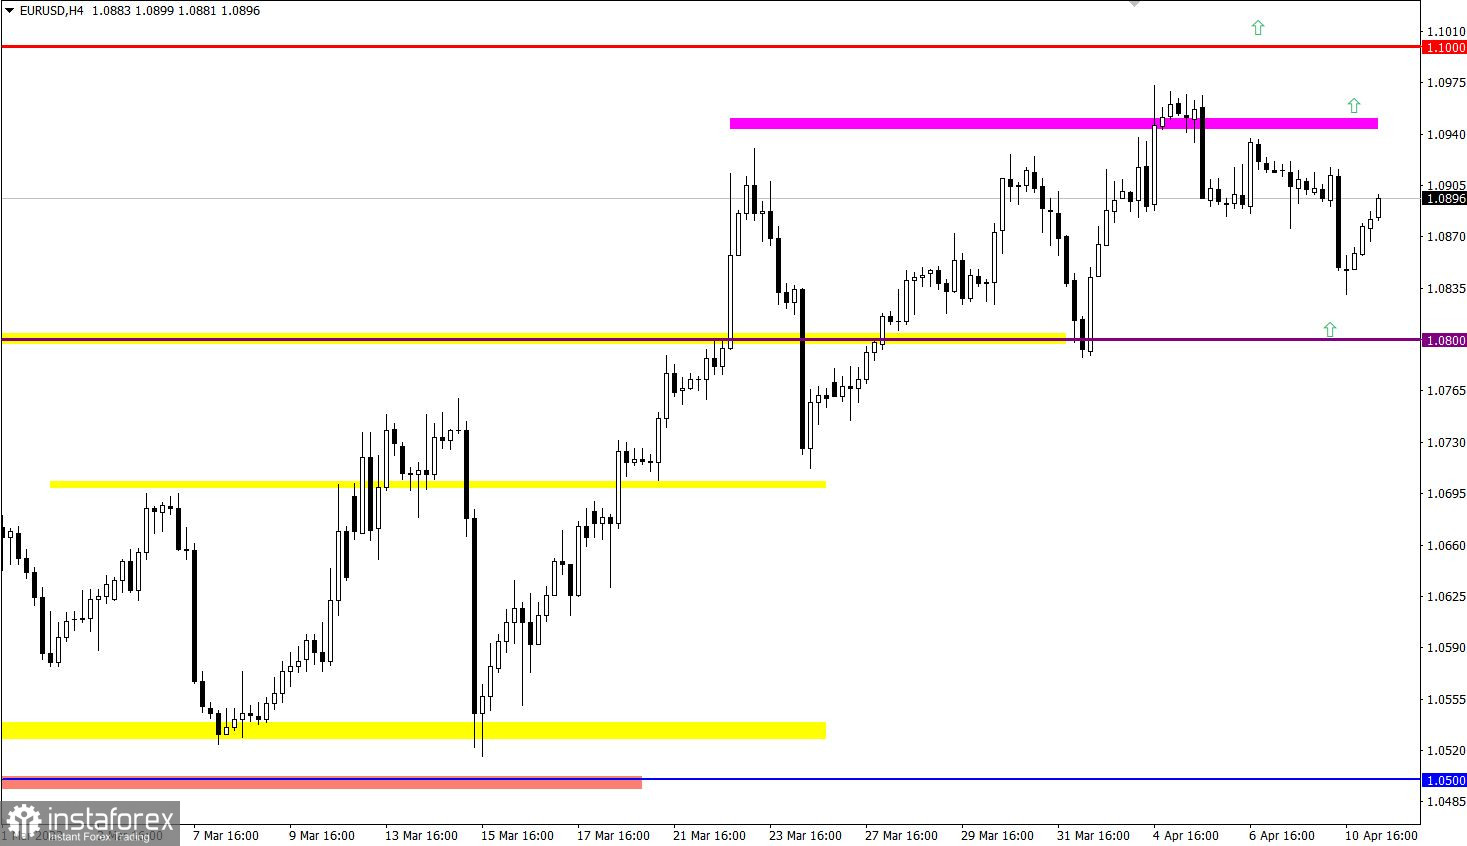
EUR/USD continues its current pullback, which resulted in an overall weakening of about 1.3%, which is about 140 pips from the local high. Despite this movement, if we compare it with the scale of the upward trend since mid-March, we can see that the upward trend still exists in the market, as the market cycle has not been broken.
In turn, GBP/USD depreciated by about 170 points, reaching 1.2350 during a pullback from the local high of the medium-term trend. Despite this price change, the market cycles with respect to the upward trend have not changed.

Economic calendar for October 11
Today is a full trading day on the financial markets, and European and Western trading floors are working as usual. On the macroeconomic calendar, EU retail sales data is expected: the rate of decline may accelerate from -2.3% to -3.1%. The consensus, on the other hand, points to an even stronger decline to -3.5%. Consumer activity is one of the best indicators that directly affects economic momentum, and its decline indicates a downturn in the economy. If the decline is confirmed or stronger than forecasted, this factor could put pressure on the euro exchange rate.
Time targeting:
EU Retail sales – 09:00 UTC
EUR/USD trading plan for April 11
Traders have almost completely recouped the speculative downward price rebound that occurred yesterday. Growth in the volume of long positions started at 1.0830, when the quote almost reached the 1.0800 support level. In order to complete the pullback and to get the technical signal about its end, the quote has to go back above 1.0950. This may lead to the prolongation of the medium-term upward trend, including the breakdown of the 1.1000 psychological level.
The downside scenario suggests a continuation of the pullback, and if the price returns below 1.0850, the quote is likely to reach the level of 1.0800.
GBP/USD trading plan for April 11
If the price returns above 1.2450, it may indicate that the pullback is over and the quote may soon update the local high. However, if the price returns below 1.2350, it could lead to an increase in short positions and a further decline in the price towards the 1.2300 support level.
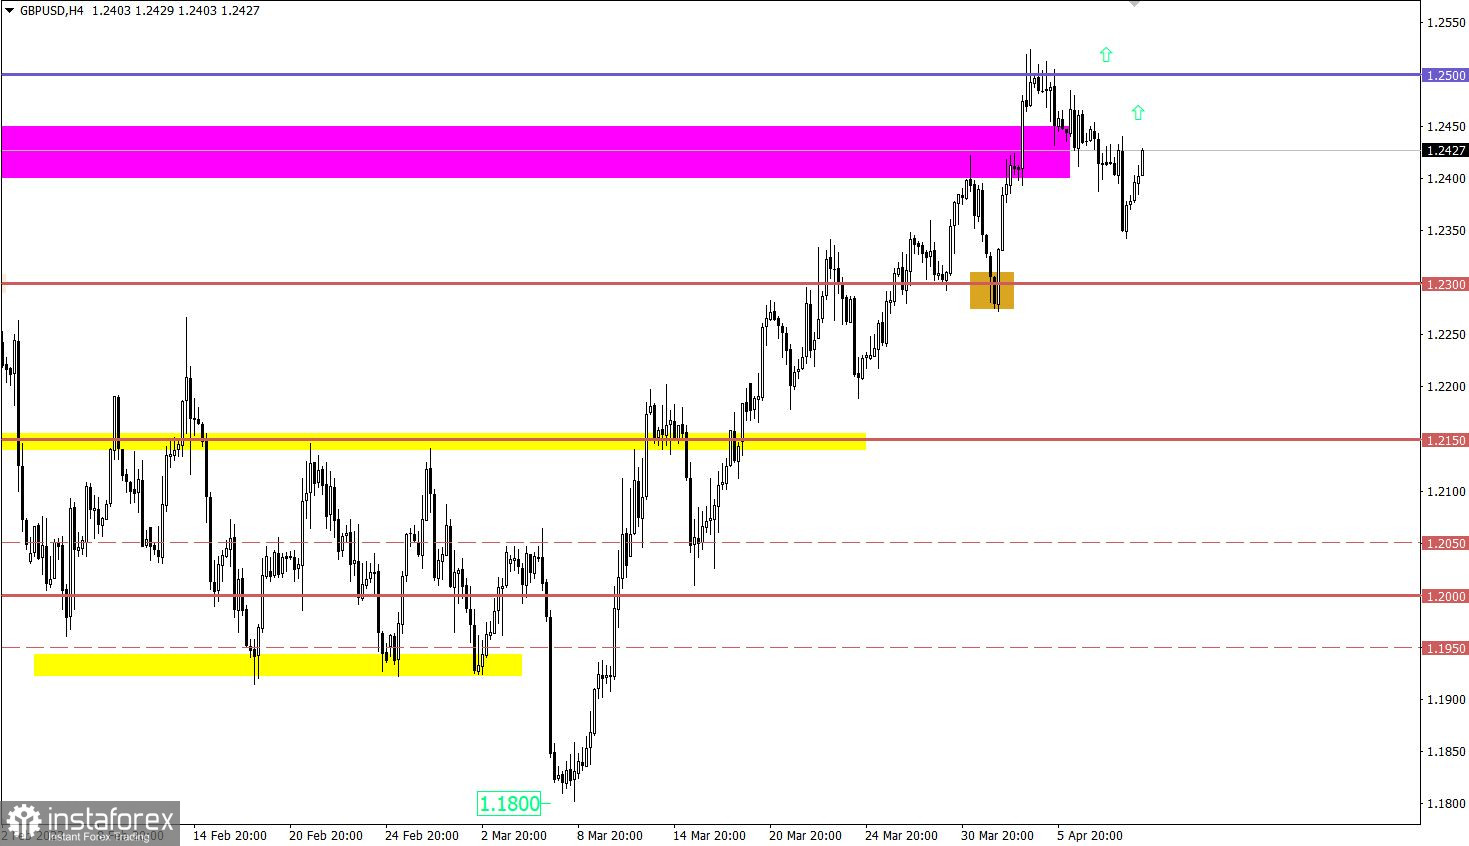
What's on the charts
The candlestick chart type is white and black graphic rectangles with lines above and below. With a detailed analysis of each individual candle, you can see its characteristics relative to a particular time frame: opening price, closing price, intraday high and low.
Horizontal levels are price coordinates, relative to which a price may stop or reverse its trajectory. In the market, these levels are called support and resistance.
Circles and rectangles are highlighted examples where the price reversed in history. This color highlighting indicates horizontal lines that may put pressure on the asset's price in the future.
The up/down arrows are landmarks of the possible price direction in the future.
* Analisis pasaran yang disiarkan di sini adalah bertujuan untuk meningkatkan kesedaran anda, tetapi tidak untuk memberi arahan untuk membuat perdagangan.
Kajian analisis InstaSpot akan membuat anda mengetahui sepenuhnya aliran pasaran! Sebagai pelanggan InstaSpot, anda disediakan sejumlah besar perkhidmatan percuma untuk dagangan yang cekap.


