


Legenda dalam pasukan InstaSpot!
Legenda! Anda fikir ia adalah satu retorik yang besar? Tetapi bagaimana untuk kita memanggil seorang lelaki, yang telah menjadi pemain Asia pertama yang memenangi kejohanan catur dunia junior pada usia 18 tahun dan menjadi Grandmaster India pertama pada usia 19 tahun? Itulah permulaan yang sukar untuk merangkul gelaran Juara Dunia untuk Viswanathan Anand, seorang juara yang telah menjadi sebahagian daripada sejarah catur. Kini satu lagi legenda dalam pasukan InstaSpot!


Borussia adalah salah satu kelab bola sepak paling terkemuka di Jerman, yang telah berulang kali membuktikan kepada peminatnya: semangat persaingan dan kepemimpinan pasti akan membawa kepada kejayaan. Berdagang dengan cara yang sama seperti atlet sukan profesional beraksi menentang lawan: yakin dan aktif. Simpan "hantaran" dari Borussia FC dan menjadi pedagang hebat dengan InstaSpot!

Overview:
The EUR/USD pair steadies near 1.0715 after USD slide. The EUR/USD pair reached a peak of 1.0715 following the release of a weak ISM Services PMI report from the US. The EUR/USD pair is currently hovering near the 1.0715 level, unchanged for the day.
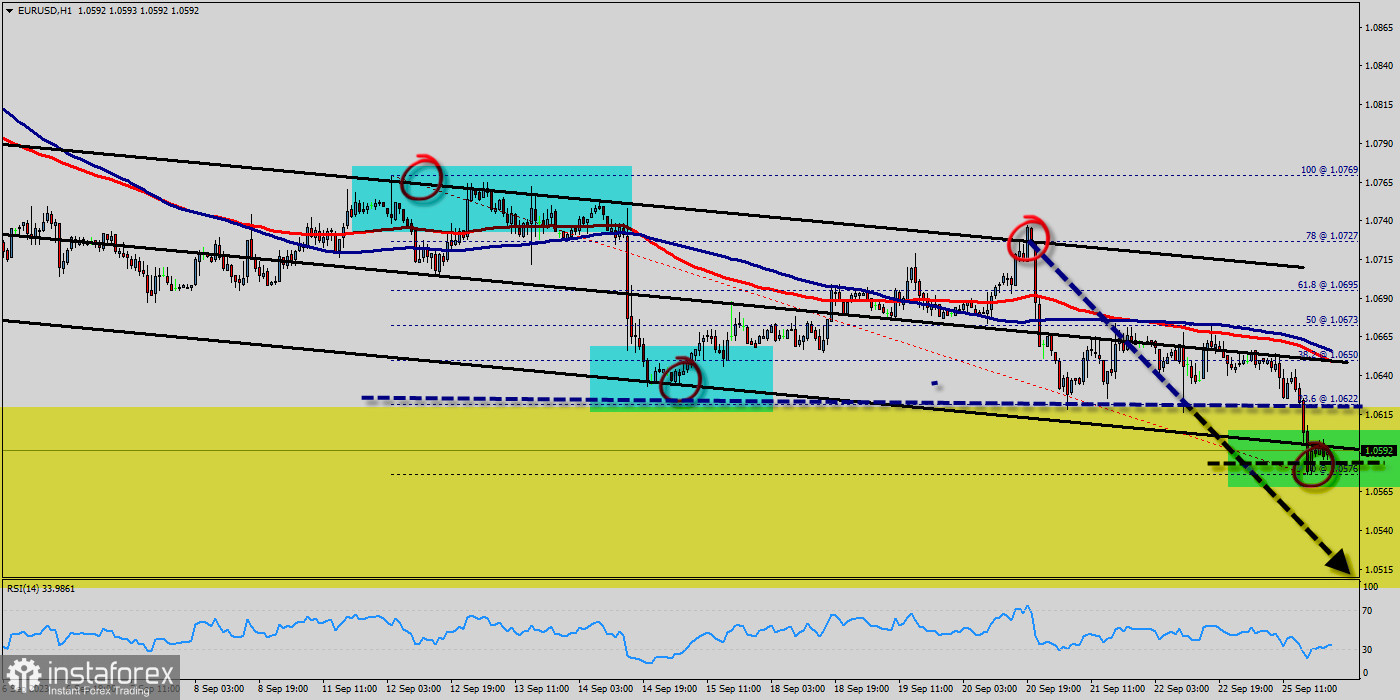
The EUR/USD pair trades with modest losses, not far above the two-week low posted last week at 1.0636. Technical readings in the daily chart favor a downward extension as a bearish 50 Simple Moving Average (SMA) heads south below a flat 100 SMA, both above the current level.
Also, the pair remains above a critical static support level, the 23.6% Fibonacci retracement of the 2023 yearly slump at 1.0682. Finally, technical indicators remain within positive levels, with neutral-to-bullish slopes.
The EUR/USD pair broke resistance which turned to strong support at the level of 1.0682 yesterday. The level of 1.0682 coincides with 23.6% of Fibonacci, which is expected to act as major support today.
Since the trend is above the 23.6% Fibonacci level, the market is still in an uptrend. From this point, the EUR/USD pair is continuing in a bullish trend from the new support of 1.0682. Currently, the price is in a bullish channel.
According to the previous events, we expect the EUR/USD pair to move between 1.0682 and 1.0789. On the H1 chart, resistance is seen at the levels of 1.0757 and 1.0789. Also, it should be noticed that, the level of 1.0734 represents the daily pivot point.
Therefore, strong support will be formed at the level of 1.0682 providing a clear signal to buy with the targets seen at 1.0734. If the trend breaks the support at 1.0734 (first resistance) the pair will move upwards continuing the development of the bullish trend to the level 1.0789 in order to test the daily resistance 2. However, stop loss is to be placed below the level of 1.0636 - last bearish wave.
* Analisis pasaran yang disiarkan di sini adalah bertujuan untuk meningkatkan kesedaran anda, tetapi tidak untuk memberi arahan untuk membuat perdagangan.
Kajian analisis InstaSpot akan membuat anda mengetahui sepenuhnya aliran pasaran! Sebagai pelanggan InstaSpot, anda disediakan sejumlah besar perkhidmatan percuma untuk dagangan yang cekap.


