


Kumpulan kami mempunyai lebih daripada 7,000,000 pedagang!
Setiap hari kami bekerjasama untuk meningkatkan perdagangan. Kami mendapat keputusan yang tinggi dan bergerak ke hadapan.
Pengiktirafan oleh berjuta-juta pedagang di seluruh dunia adalah penghargaan terbaik untuk kerja kami! Anda membuat pilihan anda dan kami akan melakukan segalanya yang diperlukan untuk memenuhi jangkaan anda!
Kami adalah kumpulan yang terbaik bersama!
InstaSpot. Berbangga bekerja untuk anda!


Pelakon, juara kejohanan UFC 6 dan seorang wira sebenar!
Lelaki yang membuat dirinya sendiri. Lelaki yang mengikut cara kami.
Rahsia di sebalik kejayaan Taktarov adalah pergerakan berterusan ke arah matlamat.
Dedahkan semua segi bakat anda!
Cari, cuba, gagal - tetapi tidak pernah berhenti!
InstaSpot. Kisah kejayaan anda bermula di sini!

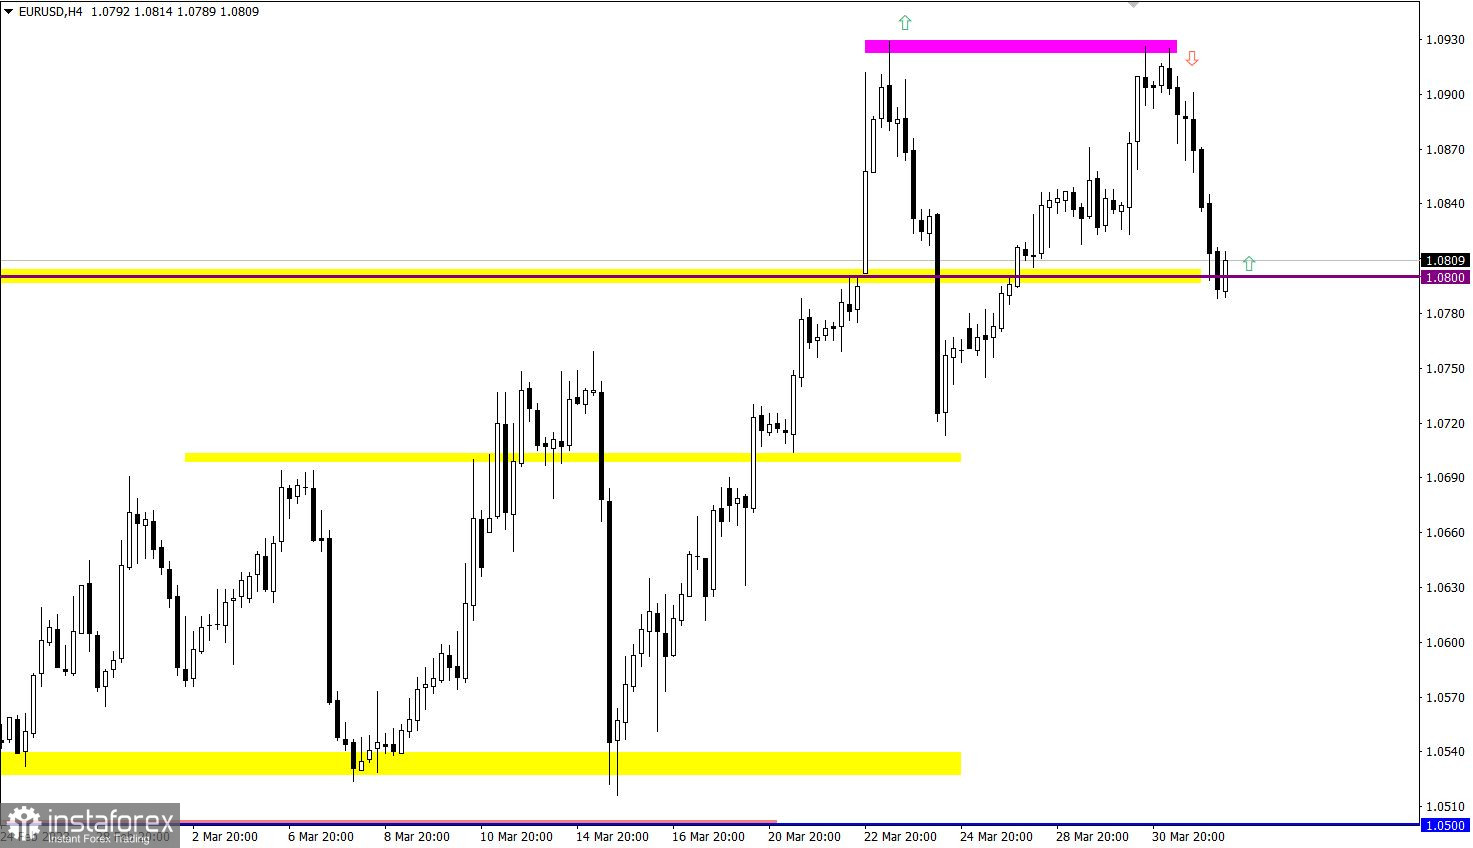
The EU consumer price index fell from 8.5% to 6.9%, with forecast of 7.4%. A noticeable decline in inflation led to a depreciation of the euro as the ECB's policy may change, given the new inflation data. Traders are laying down a revision of the current policy of interest rate hikes.
EUR/USD rebounded from the local high of March 23, at 1.0930, with surgical precision. As a result, there was an increase in the volume of short positions, on the basis of which the quote dropped to the level of 1.0800.
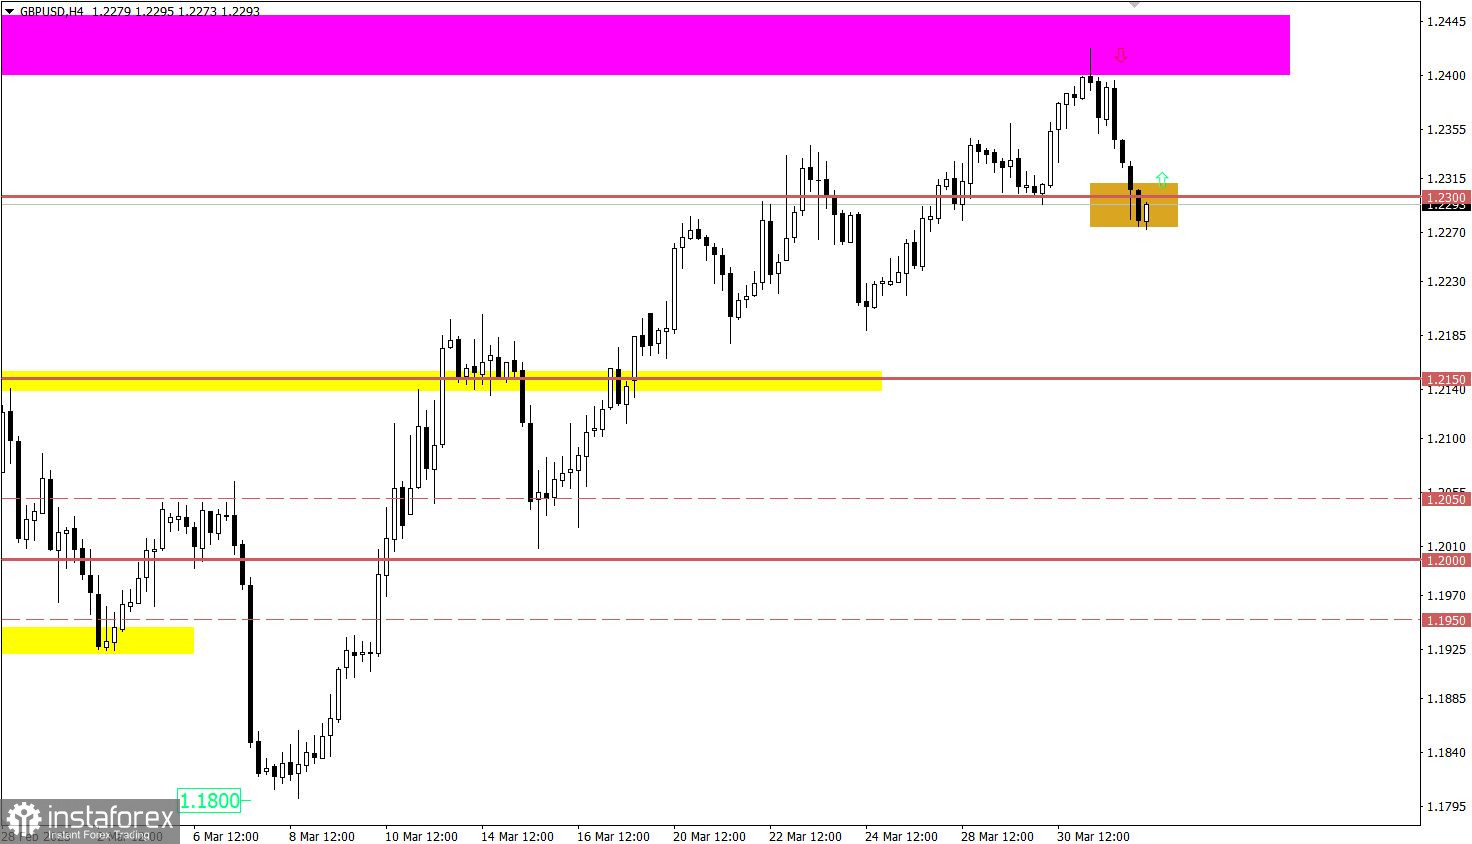
GBP/USD declined, following the euro. This occurred due to the strong positive correlation between the trading instruments EURUSD and GBPUSD. The scale of the weakening was about 130 pips, which brought the price back to 1.2300.

Today, the publication of business activity indices in the manufacturing sector in Europe, the United Kingdom, and the United States are expected. Since these data are final, not much attention from the market is expected. However, if the figures diverge from the preliminary estimates, speculative price jumps may occur.
Time targeting:
EU Manufacturing PMI – 08:00 UTC
UK Manufacturing PMI – 08:30 UTC
U.S. Manufacturing PMI – 14:00 UTC
A price change of more than 130 pips could lead to overheating of short positions in short-term timeframes. This allows the occurrence of a technical pullback or stagnation relative to the recent decline. It is worth noting that a stable price retention below 1.0770 in the four-hour period may lead to an increase in the downward cycle, in which signals about the oversold euro will be ignored by speculators.
Given the clear signs of oversold pound sterling, it is possible to reduce the volume of short positions, especially if the area around the level of 1.2300 will have a proper impact on the quote. In this case, a reverse price movement is possible.
Traders will consider the downside scenario if the price falls below 1.2250.
What's on the charts
The candlestick chart type is white and black graphic rectangles with lines above and below. With a detailed analysis of each individual candle, you can see its characteristics relative to a particular time frame: opening price, closing price, intraday high and low.
Horizontal levels are price coordinates, relative to which a price may stop or reverse its trajectory. In the market, these levels are called support and resistance.
Circles and rectangles are highlighted examples where the price reversed in history. This color highlighting indicates horizontal lines that may put pressure on the asset's price in the future.
The up/down arrows are landmarks of the possible price direction in the future.
* Analisis pasaran yang disiarkan di sini adalah bertujuan untuk meningkatkan kesedaran anda, tetapi tidak untuk memberi arahan untuk membuat perdagangan.
Kajian analisis InstaSpot akan membuat anda mengetahui sepenuhnya aliran pasaran! Sebagai pelanggan InstaSpot, anda disediakan sejumlah besar perkhidmatan percuma untuk dagangan yang cekap.


