


Kumpulan kami mempunyai lebih daripada 7,000,000 pedagang!
Setiap hari kami bekerjasama untuk meningkatkan perdagangan. Kami mendapat keputusan yang tinggi dan bergerak ke hadapan.
Pengiktirafan oleh berjuta-juta pedagang di seluruh dunia adalah penghargaan terbaik untuk kerja kami! Anda membuat pilihan anda dan kami akan melakukan segalanya yang diperlukan untuk memenuhi jangkaan anda!
Kami adalah kumpulan yang terbaik bersama!
InstaSpot. Berbangga bekerja untuk anda!


Pelakon, juara kejohanan UFC 6 dan seorang wira sebenar!
Lelaki yang membuat dirinya sendiri. Lelaki yang mengikut cara kami.
Rahsia di sebalik kejayaan Taktarov adalah pergerakan berterusan ke arah matlamat.
Dedahkan semua segi bakat anda!
Cari, cuba, gagal - tetapi tidak pernah berhenti!
InstaSpot. Kisah kejayaan anda bermula di sini!

Overview:
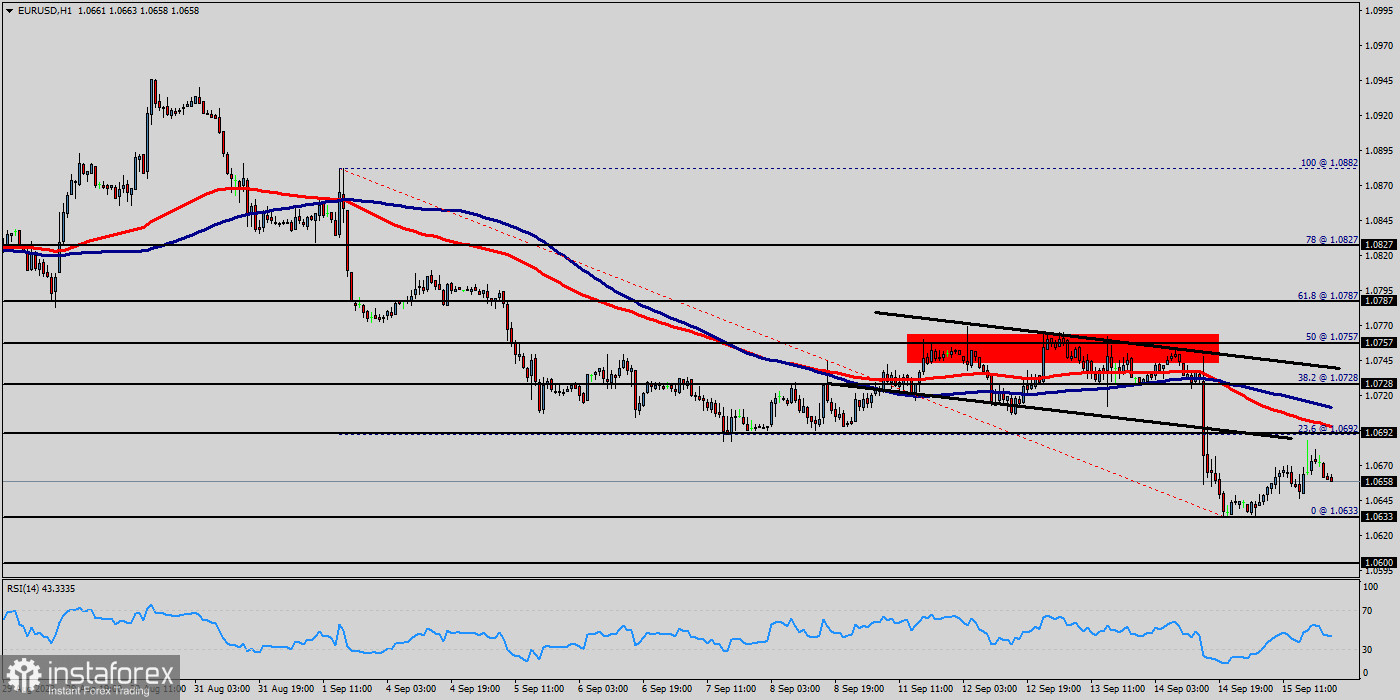
The EUR/USD pair steadies near 1.0715 after USD slide. The EUR/USD pair reached a peak of 1.0715 following the release of a weak ISM Services PMI report from the US. The EUR/USD pair is currently hovering near the 1.0715 level, unchanged for the day. The EUR/USD pair trades with modest losses, not far above the two-week low posted last week at 1.0636.
Technical readings in the daily chart favor a downward extension as a bearish 50 Simple Moving Average (SMA) heads south below a flat 100 SMA, both above the current level. Also, the pair remains above a critical static support level, the 23.6% Fibonacci retracement of the 2023 yearly slump at 1.0682.
Finally, technical indicators remain within positive levels, with neutral-to-bullish slopes. The EUR/USD pair broke resistance which turned to strong support at the level of 1.0682 yesterday. The level of 1.0682 coincides with 23.6% of Fibonacci, which is expected to act as major support today.
Since the trend is above the 23.6% Fibonacci level, the market is still in an uptrend. From this point, the EUR/USD pair is continuing in a bullish trend from the new support of 1.0682. Currently, the price is in a bullish channel. According to the previous events, we expect the EUR/USD pair to move between 1.0682 and 1.0789.
On the H1 chart, resistance is seen at the levels of 1.0757 and 1.0789. Also, it should be noticed that, the level of 1.0734 represents the daily pivot point. Therefore, strong support will be formed at the level of 1.0682 providing a clear signal to buy with the targets seen at 1.0734.
If the trend breaks the support at 1.0734 (first resistance) the pair will move upwards continuing the development of the bullish trend to the level 1.0789 in order to test the daily resistance 2. However, stop loss is to be placed below the level of 1.0636 - last bearish wave.
The EUR/USD pair continues to move upwards from the level of 1.0687. The pair rose from the level of 1.0687 (the level of 1.0687 coincides with a ratio of 0% Fibonacci retracement - last bearish wave) to a top around 1.0754. Today, the first support level is seen at 1.0687 followed by 1.0600, while daily resistance 1 is seen at 1.0785.
According to the previous events, the EUR/USD pair is still moving between the levels of 1.0687 and 1.0785; for that we expect a range of 98pips (1.0785 - 1.0687). On the one-hour chart, immediate resistance is seen at 1.0785, which coincides with a ratio of 50% Fibonacci retracement - the first bullish wave. Currently, the price is moving in a bullish channel.
This is confirmed by the RSI indicator signaling that we are still in a bullish trending market. The price is still above the moving average (100) and (50). Therefore, if the trend is able to break out through the first resistance level of 1.0785, we should see the pair climbing towards the daily resistance at 1.0808 to test it. It would also be wise to consider where to place stop loss; this should be set below the second support of 1.0687.
Bearish outlook :
If the pair fails to pass through the level of 1.0808, the market will indicate a bearish opportunity below the strong resistance level of 1.0808. In this regard, sell deals are recommended lower than the 1.0808 level with the first target at 1.0687. It is possible that the pair will turn downwards continuing the development of the bearish trend to the level 1.0603. However, stop loss has always been in consideration thus it will be useful to set it above the last double top at the level of 1.0808 (notice that the major resistance today has set at 1.0808).
* Analisis pasaran yang disiarkan di sini adalah bertujuan untuk meningkatkan kesedaran anda, tetapi tidak untuk memberi arahan untuk membuat perdagangan.
Kajian analisis InstaSpot akan membuat anda mengetahui sepenuhnya aliran pasaran! Sebagai pelanggan InstaSpot, anda disediakan sejumlah besar perkhidmatan percuma untuk dagangan yang cekap.


