


Kumpulan kami mempunyai lebih daripada 7,000,000 pedagang!
Setiap hari kami bekerjasama untuk meningkatkan perdagangan. Kami mendapat keputusan yang tinggi dan bergerak ke hadapan.
Pengiktirafan oleh berjuta-juta pedagang di seluruh dunia adalah penghargaan terbaik untuk kerja kami! Anda membuat pilihan anda dan kami akan melakukan segalanya yang diperlukan untuk memenuhi jangkaan anda!
Kami adalah kumpulan yang terbaik bersama!
InstaSpot. Berbangga bekerja untuk anda!


Pelakon, juara kejohanan UFC 6 dan seorang wira sebenar!
Lelaki yang membuat dirinya sendiri. Lelaki yang mengikut cara kami.
Rahsia di sebalik kejayaan Taktarov adalah pergerakan berterusan ke arah matlamat.
Dedahkan semua segi bakat anda!
Cari, cuba, gagal - tetapi tidak pernah berhenti!
InstaSpot. Kisah kejayaan anda bermula di sini!

In today's two reviews of the author on the euro/dollar and the pound/dollar, the results of yesterday's events related to the Fed have already been summed up, so I don't see any point in repeating myself. However, before proceeding to the consideration of the daily price chart for the dollar/yen pair, let me remind you that yesterday's decision of the US Federal Reserve System (FRS) exceeded the expectations of most analysts. Let me remind you that the consensus forecast assumed that following the results of its June meeting, the Fed would raise the federal funds rate by 50 basis points, but the rate was raised by 75 bps. Looking at the market reaction that led to the US dollar sell-off, the only thing that has to be assumed is that the previous and very strong growth of the US currency, especially paired with the Japanese yen, provided for this scenario. And now pay attention to the daily price chart.
Daily
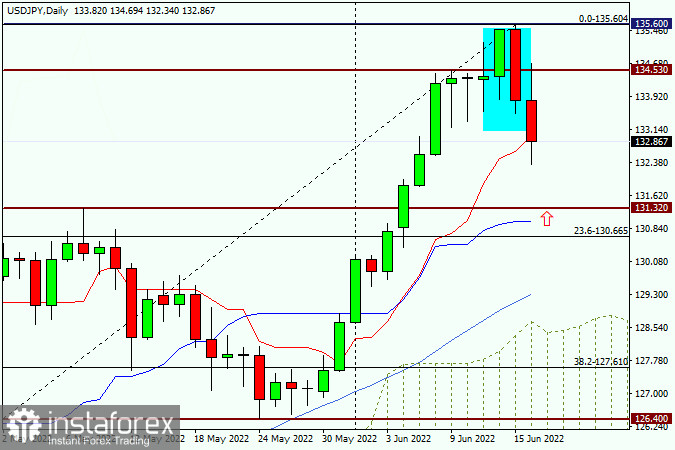
As a result of yesterday's decline, which occurred despite a more significant increase in the federal funds rate than expected, a reversal pattern of the "Bearish Absorption" candlestick analysis appeared on the USD/JPY daily chart. Let me remind you that this model consists of two candles, the last (red) of which absorbed the body of the previous bullish candle. As a result, at today's trading, the pair is trying to continue implementing the bearish scenario and is still trading with a slight decrease near the strong technical level of 133.00. As can be seen on the daily chart, the red Tenkan line of the Ichimoku indicator provides very significant support to the price. It is not for nothing that after trying to go down this line, the current daily candle already has a fairly significant lower shadow, that is, the quote bounces up from the Tenkan line. According to the Fibonacci tool grid, stretched for global growth of 114.67-135.60, it would be quite logical and technically competent to roll back to the first level of correction from this movement of 23.6 fibo. In addition, as can be seen on this chart, there is a previously broken and far from the weak resistance level of 131.32, and a little lower is the blue Kijun line of the Ichimoku indicator. All this taken together can provide USD/JPY with very strong support and reverse the course in the north direction again. Thus, I suggest not to rush right here and now, but to wait for the decline in the price zone of the expected strong support of 131.35-130.65 and plan purchases from here, that is, to open positions on the current and very strong upward trend. The confirmation signal for opening long positions on the dollar/yen pair will be the appearance of bullish reversal patterns of candle analysis on this or smaller time intervals that will appear in the selected price area. If the USD/JPY pair confidently returns to the previously broken resistance level of 131.32, it will be time to think about a trend change or at least a deeper corrective pullback.
* Analisis pasaran yang disiarkan di sini adalah bertujuan untuk meningkatkan kesedaran anda, tetapi tidak untuk memberi arahan untuk membuat perdagangan.
Kajian analisis InstaSpot akan membuat anda mengetahui sepenuhnya aliran pasaran! Sebagai pelanggan InstaSpot, anda disediakan sejumlah besar perkhidmatan percuma untuk dagangan yang cekap.


