




Nella nostra squadra ci sono più di 7.000.000 trader! Ogni giorno ci impegniamo a far sì che il trading migliori. Conseguiamo grandi risultati e ci muoviamo in avanti.
Il riconoscimento da parte di milioni di trader in tutto il mondo rappresenta l'alta valutazione della nostra attività! Voi avete fatto la vostra scelta e noi faremo la nostra al fine di soddisfare le vostre aspettative!
Assieme siamo una grande squadra!
InstaSpot. Siamo orgogliosi di lavorare per voi!





Attore, campione del mondo di lotta libera e semplicemente un vero maciste russo! Persona venuta dal nulla. Persona che rispecchia i nostri obiettivi. Il segreto del successo di Taktarov consiste nel mirare continuamente al suo scopo.
Dischiudi anche tu tutti gli aspetti del tuo talento! Impara, prova, sbaglia, ma non fermarti!
InstaSpot - la storia delle tue vittorie inizia qui!

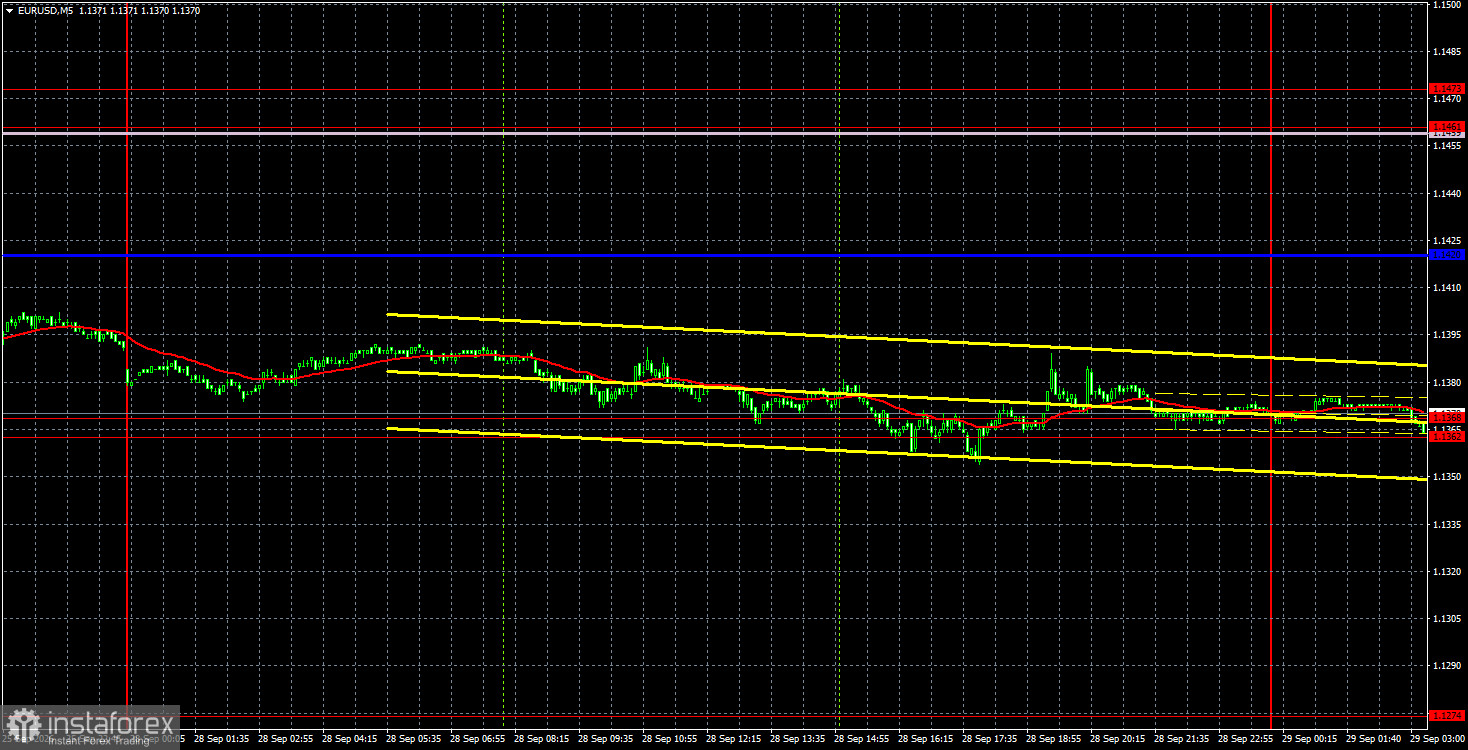
The EUR/USD pair showed no willingness on Monday to continue the correction that seemed to begin on Friday. During the day, the euro again tended toward decline while the US dollar tended to rise. Thus, the US currency strengthened slightly again, and analysts once more attributed the move to a hawkish shift in Federal Reserve policy. Accordingly, the dollar may continue to rise—contrary to the technical picture on the daily and weekly timeframes and the fundamental and macroeconomic backdrop—based solely on Fed policy. A break of the 1.1362–1.1368 area will allow the pair to continue falling within the current hourly downtrend. No major world events occurred on Monday. Donald Trump rejected another Iranian peace plan over the weekend, which again consisted only of demands. The US president is not eager to resume active hostilities in the Middle East a month before the congressional elections, so we should expect a lull for some time. However, everything could change after the elections.
Technically, the downward trend continues to form. The market keeps pricing in future Fed rate hikes, which already looks simply absurd. The trend line remains relevant, and price sits below the Ichimoku lines, so technically the pair's decline is entirely consistent—but only on the hourly timeframe. On the weekly timeframe, an uptrend persists.
On the 5-minute timeframe, no trading signals were formed on Monday. Price tested the 1.1362–1.1368 area several times but failed to produce a convincing rebound or breakout. Volatility, as we forecast, was low.
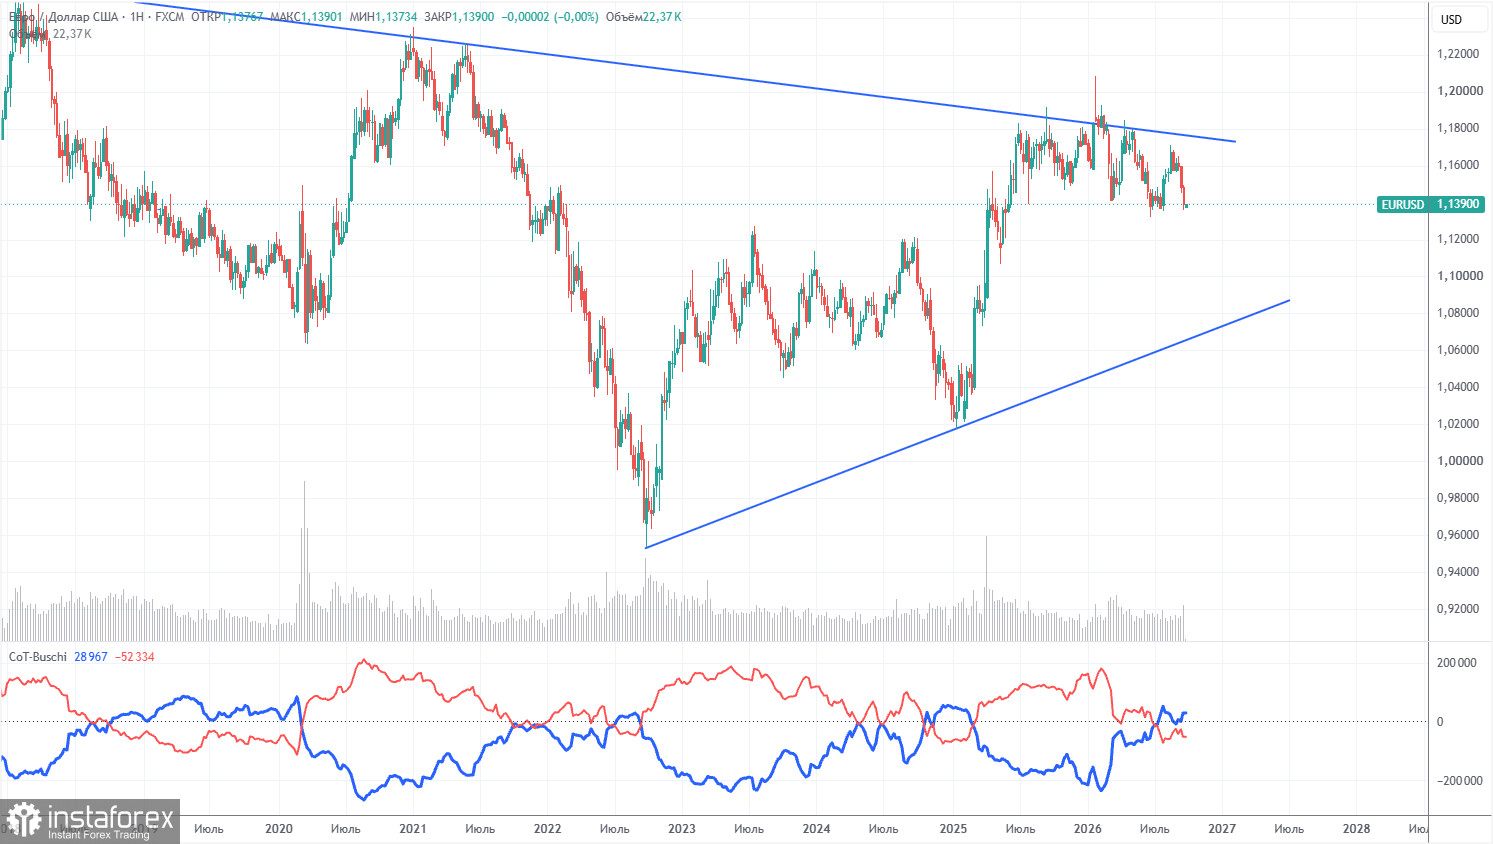
The latest COT report is dated September 22. On the weekly timeframe, non-commercial traders' net position remains clearly bearish and has significantly decreased in 2026 because of geopolitical events. Traders have been disposing of the euro in favor of the US dollar over the past six months. Donald Trump's policies have not changed, but the dollar served as a reserve currency for a time.
However, we still do not see any fundamental factors for further US dollar strengthening. The war in the Middle East made the dollar super-attractive for a while, and the Fed's monetary stance surprised the dollar a second time this year. In the long term, the euro could fall even to $1.08 (trend line), but the uptrend will remain relevant. Over recent months of dollar appreciation, the pair has not come close to that trend line.
The positions of the red and blue indicator lines indicate approximate parity between bulls and bears. During the last reporting week, the number of long positions in the "Non-commercial" group rose by 11,700, while shorts increased by 37,000. Accordingly, the net position fell by 25,300 contracts over the week.
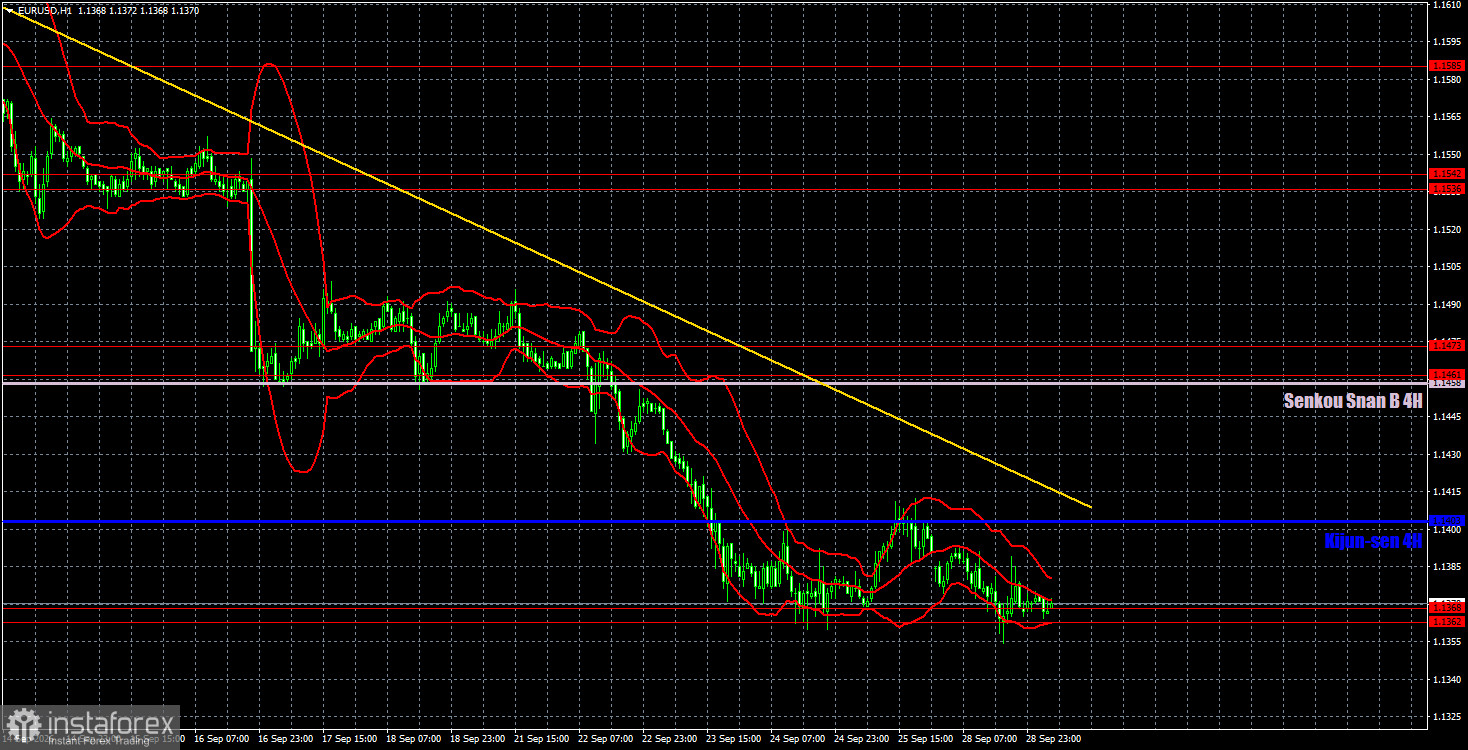
On the hourly timeframe, EUR/USD continues to form a downward trend, and the Fed has greatly contributed to the southbound move. The European Central Bank should have supported the euro by raising rates for the second time in 2026, but the market now sees only the Fed and its tightening. Thus, the dollar has effectively formed an entire trend out of nowhere, and market sentiment may remain "bearish."
For September 29 we highlight the following levels for trading — 1.1234, 1.1274, 1.1362–1.1368, 1.1461–1.1473, 1.1536–1.1542, 1.1585, 1.1657–1.1665, 1.1750–1.1760, as well as the Senkou Span B line (1.1458) and the Kijun-sen (1.1403). The Ichimoku indicator lines may shift during the day, which should be taken into account when determining trading signals. Don't forget to move the Stop Loss to breakeven if the price moves 15 pips in the correct direction. This will protect against possible losses if the signal proves false.
On Tuesday, ECB President Christine Lagarde will speak in the eurozone, but the ECB's monetary-policy stance is well known to traders. She is unlikely to surprise the market. In the US, the JOLTS job-openings report will be released today, but it is not expected to move markets. Thus, volatility in the FX market may again be low today.
If price consolidates below the 1.1362–1.1368 area, traders can consider bearish targets near 1.1274. If price rebounds again from the 1.1362–1.1368 area, consider bullish targets at 1.1403 and 1.1458.
Support and resistance price levels are thick red lines where movement may conclude. They are not sources of trading signals.
The Kijun-sen and Senkou Span B lines are Ichimoku indicator lines transferred to the hourly timeframe from the 4-hour timeframe. They are strong lines.
Extreme levels are thin red lines from which the price has previously rebounded. They are sources of trading signals.
Yellow lines indicate trend lines, trending channels, and any other technical patterns.
Indicator 1 on COT charts shows the size of the net position of each category of traders.
*La presente analisi del mercato ha un carattere esclusivamente informativo e non rappresenta una guida per l`effettuazione di una transazione.
Le recensioni analitiche di InstaSpot ti renderanno pienamente consapevole delle tendenze del mercato! Essendo un cliente InstaSpot, ti viene fornito un gran numero di servizi gratuiti per il trading efficiente.


