




Nella nostra squadra ci sono più di 7.000.000 trader! Ogni giorno ci impegniamo a far sì che il trading migliori. Conseguiamo grandi risultati e ci muoviamo in avanti.
Il riconoscimento da parte di milioni di trader in tutto il mondo rappresenta l'alta valutazione della nostra attività! Voi avete fatto la vostra scelta e noi faremo la nostra al fine di soddisfare le vostre aspettative!
Assieme siamo una grande squadra!
InstaSpot. Siamo orgogliosi di lavorare per voi!





Attore, campione del mondo di lotta libera e semplicemente un vero maciste russo! Persona venuta dal nulla. Persona che rispecchia i nostri obiettivi. Il segreto del successo di Taktarov consiste nel mirare continuamente al suo scopo.
Dischiudi anche tu tutti gli aspetti del tuo talento! Impara, prova, sbaglia, ma non fermarti!
InstaSpot - la storia delle tue vittorie inizia qui!

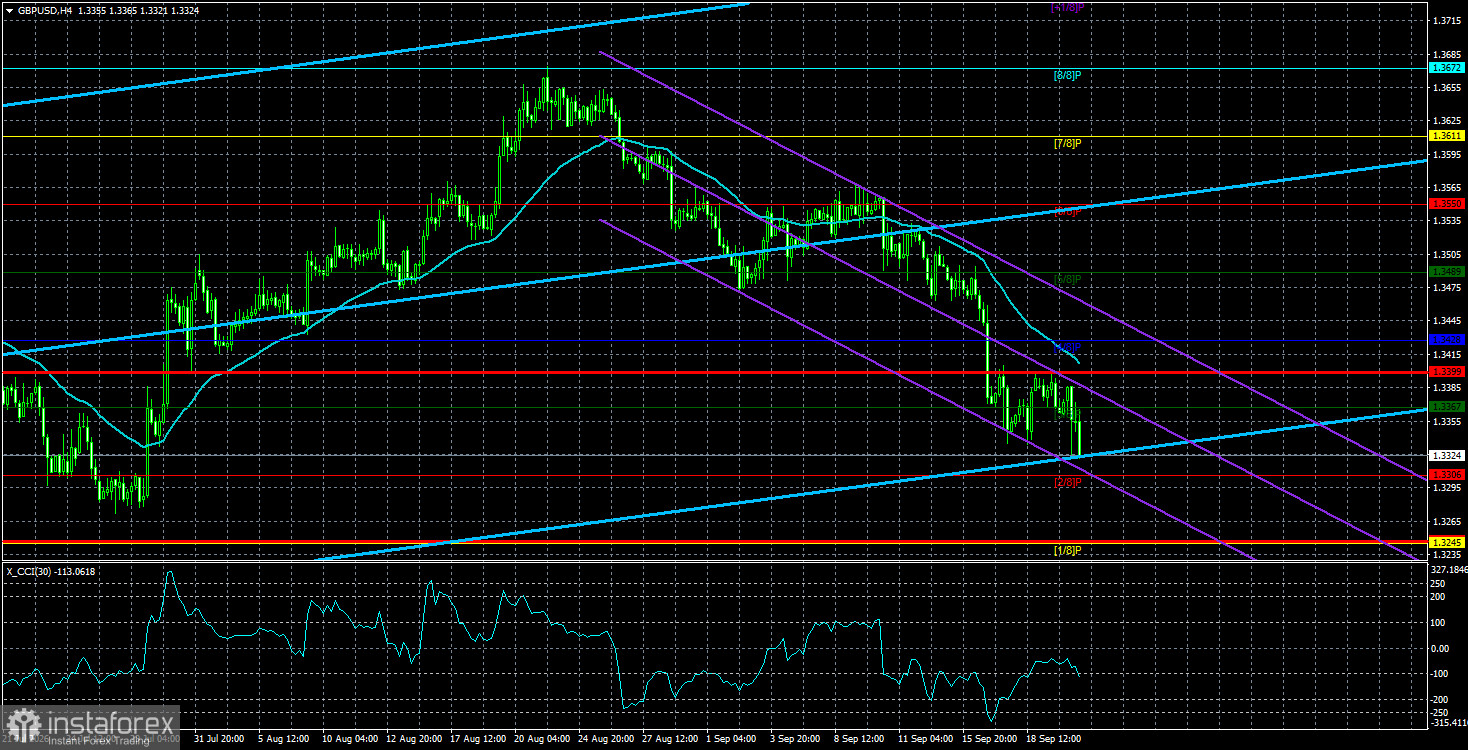
The GBP/USD pair on Tuesday again showed no notable price action. The first half of the day offered some hope: the pair briefly dropped about 60 pips, but traders could not extend the move lower through the day. Why did sterling fall again and the US dollar rally once more?
Right now the FX market is in a situation where explanations for the dollar's fresh rise must either be invented or blamed on the Federal Reserve. On Monday and Tuesday, several FOMC members spoke, repeating the mantra that rates need to rise further. For the market, these phrases are a red flag for bulls. We again ask a reasonable question: how long will the market keep reworking the same factor while ignoring everything else? Remember that inflation is high — or rising — not only in the US but also in the UK. It's not only the Fed that plans further tightening in the months ahead; the European Central Bank and the Bank of England do as well. Yes, the BoE has not yet lifted rates, but it may begin tightening at its next meeting. The market is currently treating that factor as irrelevant.
So in any uncertain situation the default explanation becomes: the Fed has turned even more hawkish, hence the dollar rises. Yet around 1.3333 the dollar is beginning to show signs of strain. Charts plainly show bears remain willing to sell GBP/USD but encounter determined buy resistance. Perhaps this latest dollar tale ends here?
We do not view the recent move down in GBP/USD as fully logical or inevitable. The market already priced Fed tightening repeatedly over the summer; it worked through the rate rise in the week before the Fed meeting, and now it still focuses almost exclusively on Fed policy. Thus, if the pair's decline were to end now, that would be reasonable. Sterling does not need anything supernatural to rally: the pound is undervalued, oversold, and underappreciated by traders. A rally without a local catalyst would be perfectly sensible.
Also recall that on the daily and weekly timeframes, the market is in a flat that has lasted a year. In effect, the dollar has shown no sustained long-term advance in 2026 — it has been trading inside a sideways channel, and price action within such a channel can be erratic. That may explain the illogical local moves. On the daily chart, price has reached the Senkou Span B line, which provides strong support—another factor in favor of a GBP/USD bounce.
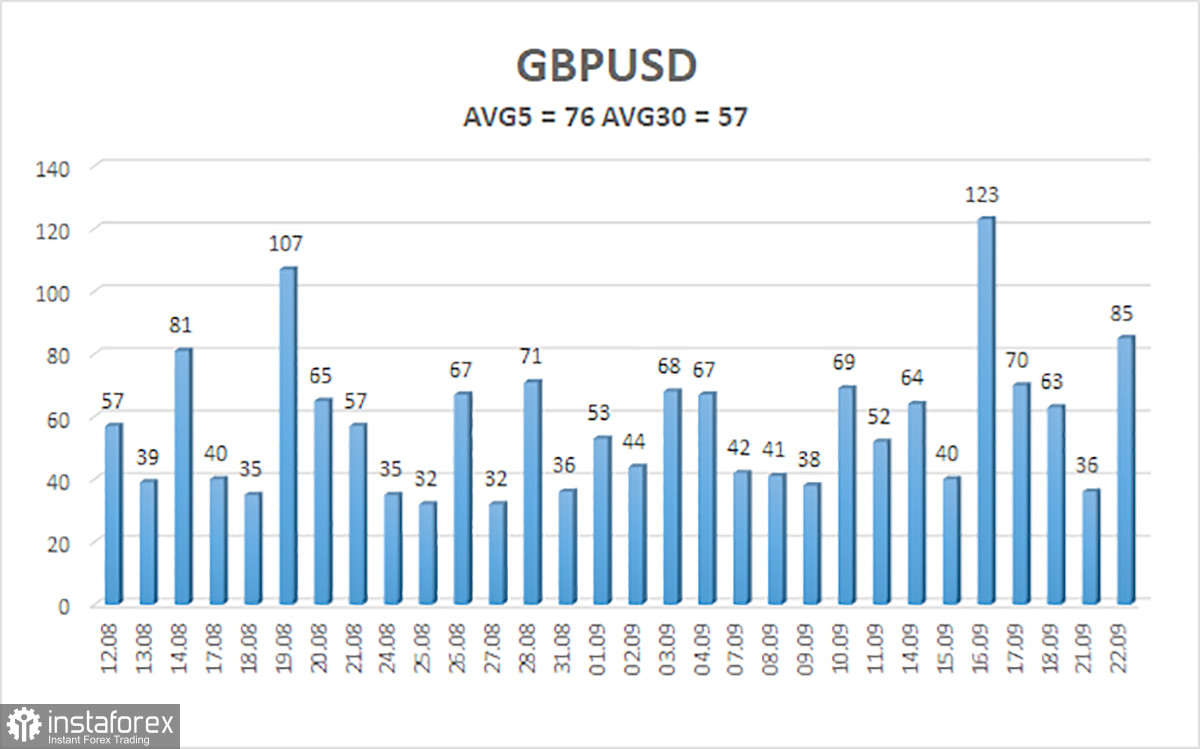
The average volatility of the GBP/USD pair over the last 5 trading days is 76 pips. For the pound/dollar, this value is classified as "medium." Therefore, on Wednesday, September 23, we expect movement inside a range bounded by 1.3247 and 1.3399. The higher linear-regression channel has turned up, indicating an uptrend. The CCI entered the oversold area, warning of a possible end to the downward trend.
S1 – 1.3306
S2 – 1.3245
S3 – 1.3184
R1 – 1.3367
R2 – 1.3428
R3 – 1.3489
The GBP/USD pair maintains an uptrend. Donald Trump's policies will continue to weigh on the US economy, so we do not expect long-term dollar strength. So far, 2026 has been positive for the dollar due to geopolitics and inflation, which have driven capital to safe havens and prompted the Fed to return to tightening. However, on the weekly timeframe, price remains flat between 1.3150 and 1.3780 within a four-year uptrend, supporting expectations for continued sterling appreciation in the medium term. Long positions with targets 1.3489 and 1.3550 can be considered while price is above the moving average. Price below the moving average would justify bearish trading, with targets of 1.3306 and 1.3245.
Regression channels help determine the current trend. If both are directed in the same direction, it means the trend is currently strong;
The moving average line (settings 20,0, smoothed) defines the short-term trend and the direction in which trading should be conducted at present;
Murray levels are target levels for moves and corrections;
Volatility levels (red lines) are the probable price channel within which the pair will spend the next 24 hours based on current volatility indicators;
The CCI indicator – its entry into the oversold area (below -250) or the overbought area (above +250) indicates that a trend reversal in the opposite direction is approaching.
*La presente analisi del mercato ha un carattere esclusivamente informativo e non rappresenta una guida per l`effettuazione di una transazione.
Le recensioni analitiche di InstaSpot ti renderanno pienamente consapevole delle tendenze del mercato! Essendo un cliente InstaSpot, ti viene fornito un gran numero di servizi gratuiti per il trading efficiente.


