




The direction of the short-term price trend of the British pound major pair has been determined by an upward wave algorithm since the end of June this year. A month ago, the quotes reached the boundaries of a potential reversal zone on the weekly timeframe. Since August 20, the price has been forming a correction. Its structure does not appear to be complete at present.
Over the coming week, the downward movement of the British pound is expected to come to an end. During the first few days, pressure on its lower boundary and a brief break below it cannot be ruled out. Subsequently, a change in direction and the beginning of upward price movement can be expected. Resistance is located at the lower level of the reversal zone on the weekly timeframe.
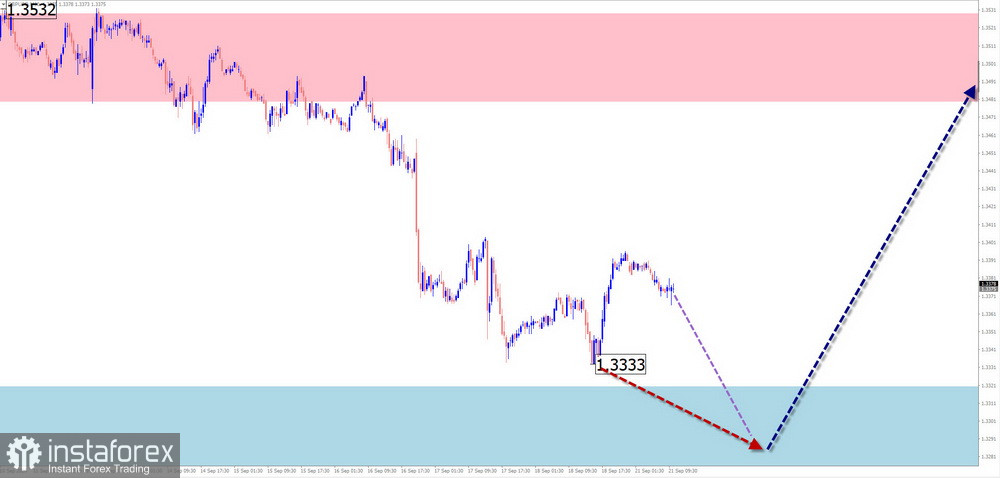
Resistance:
Support:
Sales: Risky and may result in losses.
Purchases: May become the main trading direction if appropriate signals appear on your technical systems.
The upward wave zigzag that started at the end of June brought the Australian dollar into the area of a strong potential reversal zone. The corrective wave section, which remains incomplete at present, started on August 21. The wave structure does not appear to be complete at the time of analysis.
At the beginning of the coming week, a downward direction is more likely, with price movement remaining sideways in nature. Closer to the weekend, the probability of a reversal from the resistance zone and the beginning of upward price movement increases. The calculated resistance limits the expected upper boundary of the pair's weekly trading range.
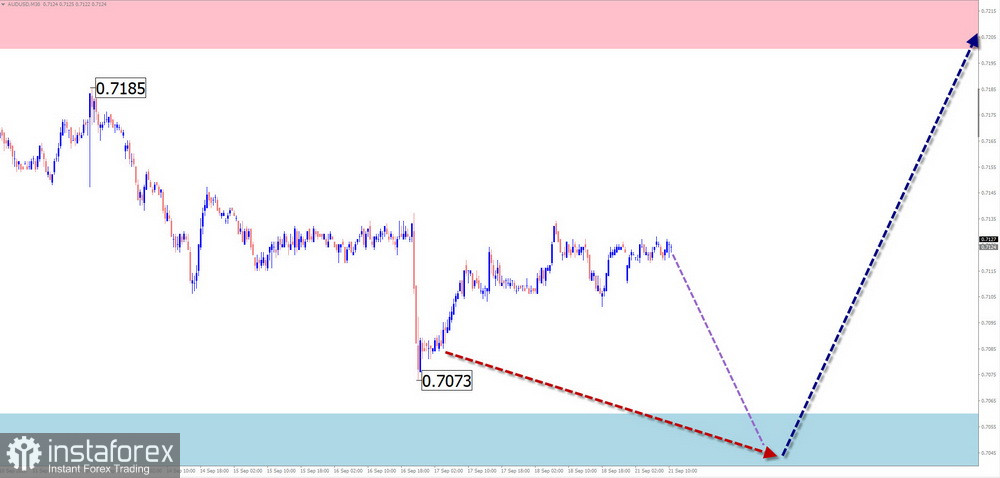
Resistance:
Support:
Sales: May be used during individual sessions with a reduced position size. The potential is limited by support.
Purchases: Will become relevant after confirmed reversal signals appear near the support zone.
The direction of the short-term trend of the Swiss franc major pair has been determined by a bullish wave forming as a zigzag since the end of January. Its high potential suggests that the entire movement may transition to the daily timeframe. The unfinished part (C) of the entire wave dates from August 20. In recent days, the quotes have retraced downward, forming a corrective retracement within it.
The coming week is expected to be similar in character to the previous weeks. After a probable movement along the support boundaries during the first few days, a resumption of upward price movement can be expected toward the weekend. The calculated resistance indicates the maximum expected extent of the upward price movement.
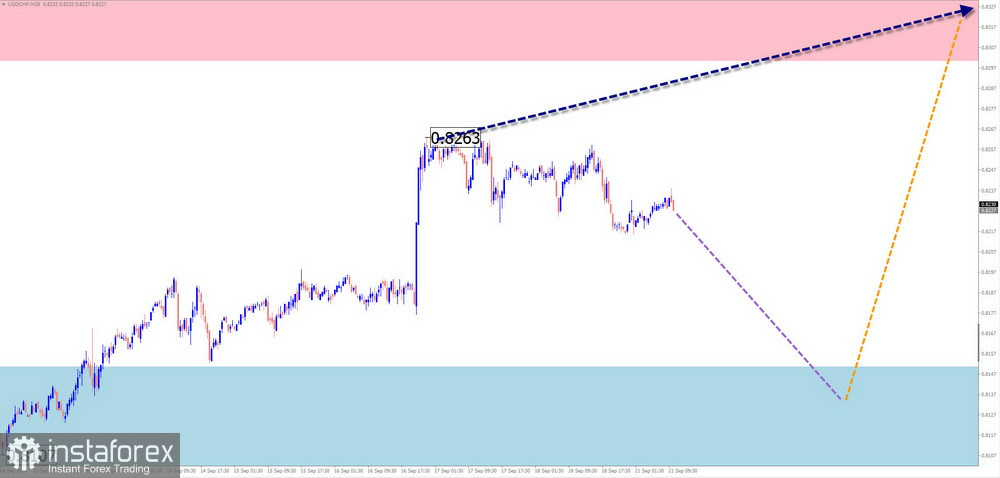
Resistance:
Support:
Sales: Carry high risk and have limited potential.
Purchases: May become the main direction for trading after signals appear on your technical systems near the support zone.
Since the beginning of August, the direction of the euro/yen pair has been determined by an upward wave algorithm. Within the wave structure, which takes the form of an expanded flat, the final section has been developing over the past three weeks and remains incomplete at present. The upward segment of the movement within the correction has formed the middle part (B) over the past month.
Over the next couple of days, the downward movement is expected to continue, potentially reaching the support boundaries. By the middle of the week, the probability of increased volatility, a change in direction, and a resumption of upward price movement increases.
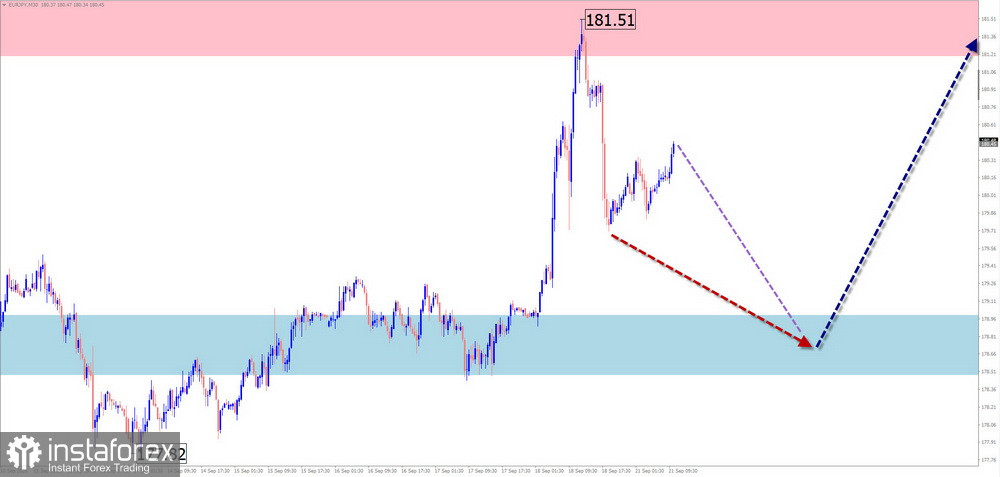
Resistance:
Support:
Sales: Permitted with a reduced position size for intraday trading.
Purchases: May be used for trading. Entry should be guided by signals from your technical systems.
The direction of the short-term trend of the euro/Swiss franc pair has been determined by an upward wave since March this year. In recent weeks, a corrective flat has been forming within the structure, confined to a price channel between the ninety-fifth and ninety-third figures. Its structure does not appear to be complete at the time of analysis.
During the first few days of the coming week, sideways price movement with a downward direction is expected for the cross. Pressure on the lower boundary of the support zone cannot be ruled out. A reversal and resumption of upward price movement can be expected closer to the end of the week. A breakout above the boundaries of the calculated resistance is unlikely.
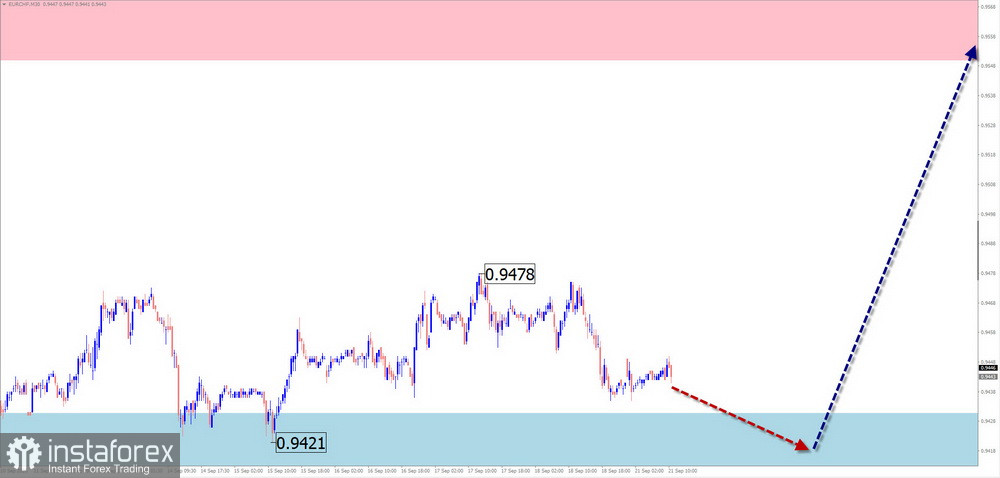
Resistance:
Support:
Sales: May be considered with a reduced position size for intraday trading.
Purchases: May be used for trading from the support zone after appropriate signals appear on your technical systems.
The short-term period of strengthening in Bitcoin's position is approaching completion. Since August 21, a downward expanded flat has been developing on the chart and remains incomplete at present. The quotes are approaching the lower boundary of a potential reversal zone on the weekly timeframe.
During the first half of the coming week, the coin is expected to continue moving along the resistance boundaries. A reversal and the beginning of a decline are more likely toward the end of the week. A change in direction will very likely be accompanied by a sharp increase in volatility. Any major news affecting the global economy could trigger the reversal.
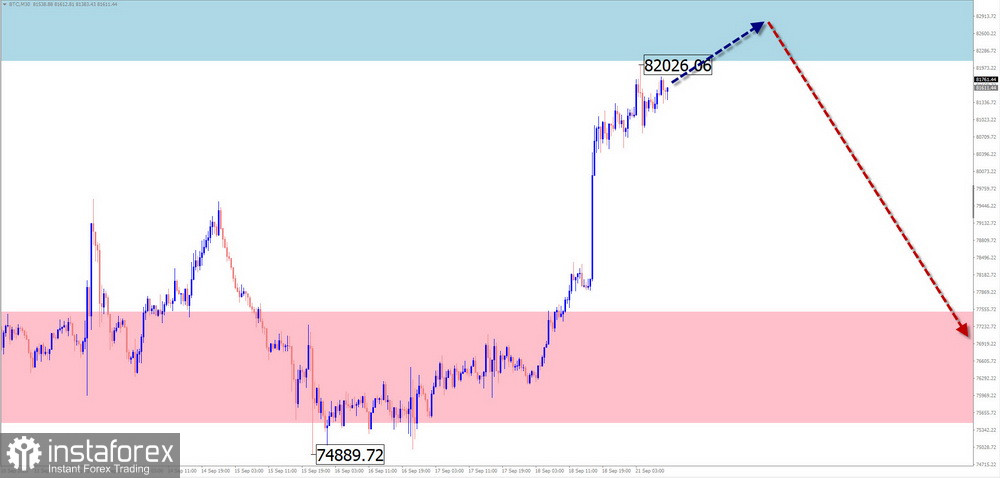
Resistance:
Support:
Purchases: Have limited potential and carry high risk.
Sales: May be considered for trading after reversal signals from your technical systems appear near the resistance zone.
In simplified wave analysis (SWA), all waves consist of three parts (A-B-C). On each timeframe, the latest incomplete wave is analyzed. Expected movements are shown with a dashed line.
Attention: The wave algorithm does not take into account the duration of an instrument's movements over time.
*La presente analisi del mercato ha un carattere esclusivamente informativo e non rappresenta una guida per l`effettuazione di una transazione.
Le recensioni analitiche di InstaSpot ti renderanno pienamente consapevole delle tendenze del mercato! Essendo un cliente InstaSpot, ti viene fornito un gran numero di servizi gratuiti per il trading efficiente.









