




Nella nostra squadra ci sono più di 7.000.000 trader! Ogni giorno ci impegniamo a far sì che il trading migliori. Conseguiamo grandi risultati e ci muoviamo in avanti.
Il riconoscimento da parte di milioni di trader in tutto il mondo rappresenta l'alta valutazione della nostra attività! Voi avete fatto la vostra scelta e noi faremo la nostra al fine di soddisfare le vostre aspettative!
Assieme siamo una grande squadra!
InstaSpot. Siamo orgogliosi di lavorare per voi!





Attore, campione del mondo di lotta libera e semplicemente un vero maciste russo! Persona venuta dal nulla. Persona che rispecchia i nostri obiettivi. Il segreto del successo di Taktarov consiste nel mirare continuamente al suo scopo.
Dischiudi anche tu tutti gli aspetti del tuo talento! Impara, prova, sbaglia, ma non fermarti!
InstaSpot - la storia delle tue vittorie inizia qui!

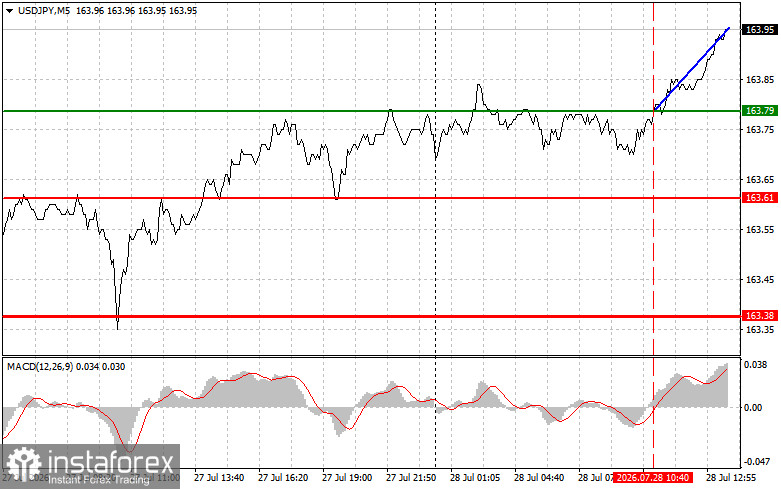
The test of the 163.79 price level occurred when the MACD indicator had just started moving upward from the zero line, which confirmed the validity of the entry point for buying the US dollar. As a result, the pair rose by 15 points.
Attention will now turn to the US trade balance report. This release will provide insight into the extent to which the volume of imported goods exceeds the volume of exported goods. Analysing the dynamics of this report will allow traders to assess the competitiveness of US products in global markets. An increase in the indicator could support further gains in the dollar.
After the release of the trade balance data, market participants will closely monitor the consumer confidence index. This indicator is generally considered a leading indicator, as it reflects consumer sentiment and expectations regarding future economic conditions and personal financial prospects. High consumer confidence is usually accompanied by increased consumer spending, which represents one of the most significant components of the US economy. Conversely, a decline in this indicator may signal a slowdown in business activity and a decrease in consumer demand.
The Richmond Fed Manufacturing Index will also be of interest, as it will provide information about current manufacturing activity in the region covered by the Federal Reserve Bank of Richmond. Like other regional manufacturing indices, this indicator helps assess overall industrial trends, including production volumes, new orders, employment, and prices. Positive readings and improving index dynamics could lead to further growth in the USD/JPY pair.
Regarding the intraday strategy, I will primarily focus on the implementation of Scenario #1 and Scenario #2.
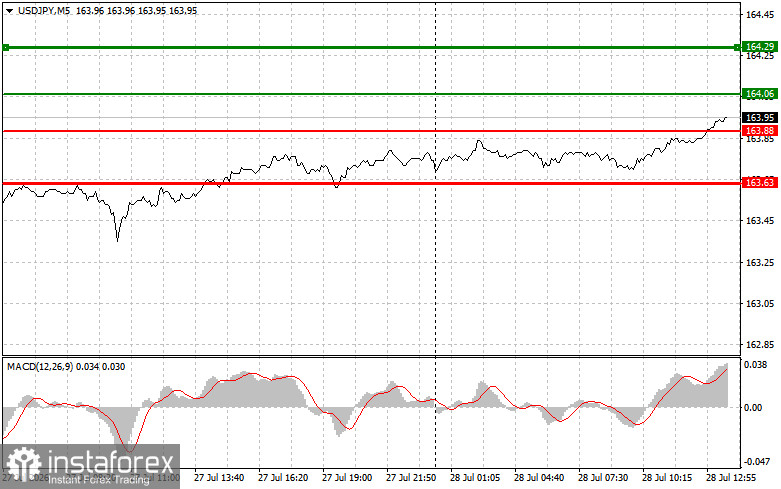
Today, I plan to buy USD/JPY once the entry point around 164.06 is reached (the green line on the chart), with a target move towards 164.29 (the thicker green line on the chart). Around 164.29, I will exit long positions and open short positions in the opposite direction, expecting a move of 30–35 points from the level. A rise in the pair today is possible, but the upward potential is relatively limited.
Important: Before buying, make sure that the MACD indicator is above the zero line and has only just started moving upward from it.
I also plan to buy USD/JPY today if there are two consecutive tests of the 163.88 price level while the MACD indicator is in the oversold zone. This would limit the pair's downward potential and trigger a reversal higher. A move towards the opposite levels of 164.06 and 164.29 can then be expected.
Sell SignalToday, I plan to sell USD/JPY after the 163.88 level is updated (the red line on the chart), which would lead to a rapid decline in the pair. The key target for sellers will be 163.63, where I will exit short positions and immediately open long positions in the opposite direction, expecting a move of 20–25 points from the level. Selling pressure on the pair may return today if the central bank intervenes.
Important: Before selling, make sure that the MACD indicator is below the zero line and has only just started moving downward from it.
I also plan to sell USD/JPY today if there are two consecutive tests of the 164.06 price level while the MACD indicator is in the overbought zone. This would limit the pair's upward potential and trigger a reversal lower. A decline towards the opposite levels of 163.88 and 163.63 can then be expected.
Important: Beginner Forex traders should be extremely cautious when making market entry decisions. Before the release of important fundamental reports, it is best to stay out of the market to avoid exposure to sharp price fluctuations. If you decide to trade during news releases, always place stop orders to minimise losses. Without stop-loss orders, you can lose your entire deposit very quickly, especially if you do not use proper money management and trade with large position sizes.
Remember that successful trading requires a clear trading plan, such as the one presented above. Making spontaneous trading decisions based on the current market situation is an inherently losing strategy for an intraday trader.
*La presente analisi del mercato ha un carattere esclusivamente informativo e non rappresenta una guida per l`effettuazione di una transazione.
Le recensioni analitiche di InstaSpot ti renderanno pienamente consapevole delle tendenze del mercato! Essendo un cliente InstaSpot, ti viene fornito un gran numero di servizi gratuiti per il trading efficiente.


