




Nella nostra squadra ci sono più di 7.000.000 trader! Ogni giorno ci impegniamo a far sì che il trading migliori. Conseguiamo grandi risultati e ci muoviamo in avanti.
Il riconoscimento da parte di milioni di trader in tutto il mondo rappresenta l'alta valutazione della nostra attività! Voi avete fatto la vostra scelta e noi faremo la nostra al fine di soddisfare le vostre aspettative!
Assieme siamo una grande squadra!
InstaSpot. Siamo orgogliosi di lavorare per voi!





Attore, campione del mondo di lotta libera e semplicemente un vero maciste russo! Persona venuta dal nulla. Persona che rispecchia i nostri obiettivi. Il segreto del successo di Taktarov consiste nel mirare continuamente al suo scopo.
Dischiudi anche tu tutti gli aspetti del tuo talento! Impara, prova, sbaglia, ma non fermarti!
InstaSpot - la storia delle tue vittorie inizia qui!

Bitcoin and Ether have slowed their advance following the bullish rally during the Asian session and appear ready for a downward reversal.

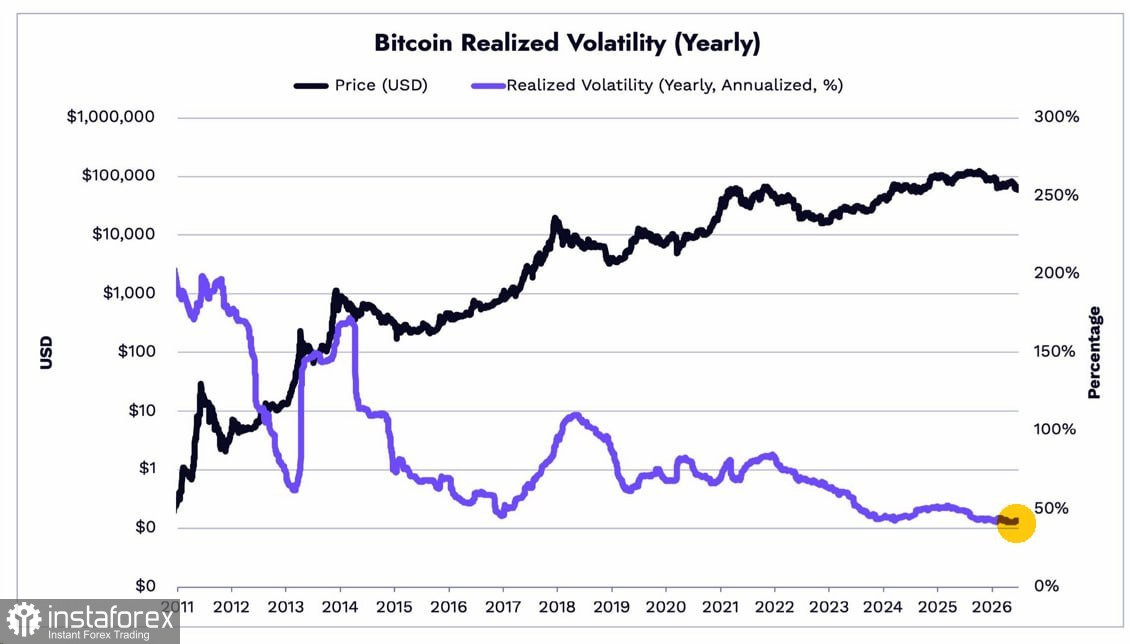
Meanwhile, Bitcoin's annual realised volatility chart shows a picture that would have seemed impossible for this asset several years ago. From 2011 to 2014, the indicator regularly exceeded 150–180% and at times approached 200%, reflecting the early stage of the market, when prices could double or fall by half within just a few weeks. After the Mt. Gox exchange collapsed in 2014, volatility declined sharply and remained within the 50–100% range for almost a decade, with local spikes in 2018 and 2021–2022, each coinciding with sharp price movements during market cycles.
Since around 2023, the chart has shown a sustained downward trend in volatility, which has continued despite Bitcoin's price increase from around $20,000 to levels above $100,000. This represents a significant divergence from previous cycles, when price increases were almost always accompanied by rising volatility. Currently, the indicator has fallen to a historical low of around 30–40%, marked by the yellow circle at the end of the chart. In other words, Bitcoin is demonstrating, for the first time in its history, a combination of a high price and low volatility — behaviour that is much more typical of mature traditional assets than of an asset known for speculative trading.
This decline in volatility is consistent with structural changes in the market that have been observed in recent months. The market is awaiting the final major event of the year — the adoption of the CLARITY Act.
As for short-term trading, the strategy and conditions are outlined below.
Bitcoin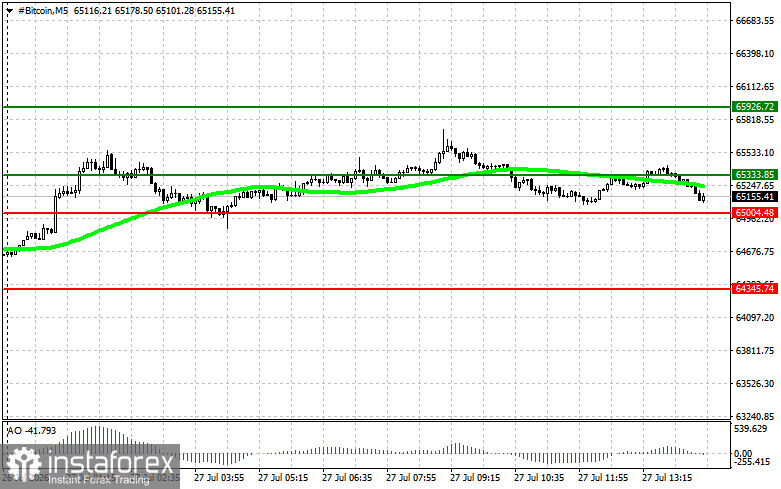
Scenario #1: I will buy Bitcoin today if the entry point is reached near $65,300, with a target of a move higher towards $65,900. Around $65,900, I will close long positions and immediately sell on a rebound. Before buying a breakout, it is necessary to confirm that the 50-day moving average is below the current price and that the Awesome Oscillator is above zero.
Scenario #2: Bitcoin can be bought from the lower boundary at $65,000 if there is no market reaction to a breakout below this level and the price returns towards $65,300 and $65,900.
Scenario #1: I will sell Bitcoin today if the entry point is reached near $65,000, with a target of a decline towards $64,300. Around $64,300, I will close short positions and immediately buy on a rebound. Before selling a breakout, it is necessary to confirm that the 50-day moving average is above the current price and that the Awesome Oscillator is below zero.
Scenario #2: Bitcoin can be sold from the upper boundary at $65,300 if there is no market reaction to a breakout above this level and the price returns towards $65,000 and $64,300.
Ethereum
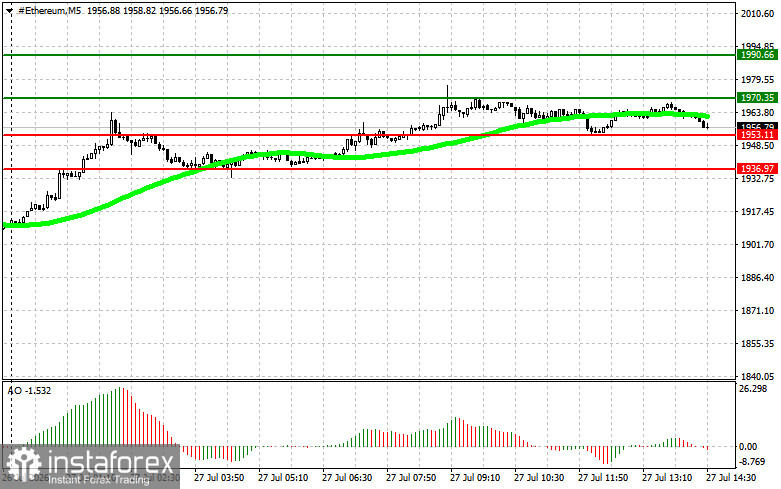
Scenario #1: I will buy Ether today if the entry point is reached near $1,970, with a target of a move higher towards $1,990. Around $1,990, I will close long positions and immediately sell on a rebound. Before buying a breakout, it is necessary to confirm that the 50-day moving average is below the current price and that the Awesome Oscillator is above zero.
Scenario #2: Ether can be bought from the lower boundary at $1,953 if there is no market reaction to a breakout below this level and the price returns towards $1,970 and $1,990.
Scenario #1: I will sell Ether today if the entry point is reached near $1,953, with a target of a decline towards $1,936. Around $1,936, I will close short positions and immediately buy on a rebound. Before selling a breakout, it is necessary to confirm that the 50-day moving average is above the current price and that the Awesome Oscillator is below zero.
Scenario #2: Ether can be sold from the upper boundary at $1,970 if there is no market reaction to a breakout above this level and the price returns towards $1,953 and $1,936.
*La presente analisi del mercato ha un carattere esclusivamente informativo e non rappresenta una guida per l`effettuazione di una transazione.
Le recensioni analitiche di InstaSpot ti renderanno pienamente consapevole delle tendenze del mercato! Essendo un cliente InstaSpot, ti viene fornito un gran numero di servizi gratuiti per il trading efficiente.


