


Nella nostra squadra ci sono più di 7.000.000 trader! Ogni giorno ci impegniamo a far sì che il trading migliori. Conseguiamo grandi risultati e ci muoviamo in avanti.
Il riconoscimento da parte di milioni di trader in tutto il mondo rappresenta l'alta valutazione della nostra attività! Voi avete fatto la vostra scelta e noi faremo la nostra al fine di soddisfare le vostre aspettative!
Assieme siamo una grande squadra!
InstaSpot. Siamo orgogliosi di lavorare per voi!


Attore, campione del mondo di lotta libera e semplicemente un vero maciste russo! Persona venuta dal nulla. Persona che rispecchia i nostri obiettivi. Il segreto del successo di Taktarov consiste nel mirare continuamente al suo scopo.
Dischiudi anche tu tutti gli aspetti del tuo talento! Impara, prova, sbaglia, ma non fermarti!
InstaSpot - la storia delle tue vittorie inizia qui!

The GBP/USD pair showed decent growth on Monday, unlike the EUR/USD pair. What caused the divergence between these two major currency pairs? The answer is clear. It became known yesterday that UK Prime Minister Keir Starmer is resigning. Thus, there will be seven prime ministers in Britain over the last ten years. It is easy to infer that none of them have completed their terms in office, indicating a structural, long-term political crisis. Notably, this crisis began immediately after the Brexit referendum in 2016. The market reacted positively to the news of yet another change in the prime minister. Political analysts suggest that Starmer's government failed to achieve its objectives, lost the trust of the electorate, and overall could not solve the issues left by the Conservatives after 14 years in power. Nonetheless, the market welcomes the change of power in Great Britain. The downward trend in the British pound remains, so the currency can only count on a correction for now.
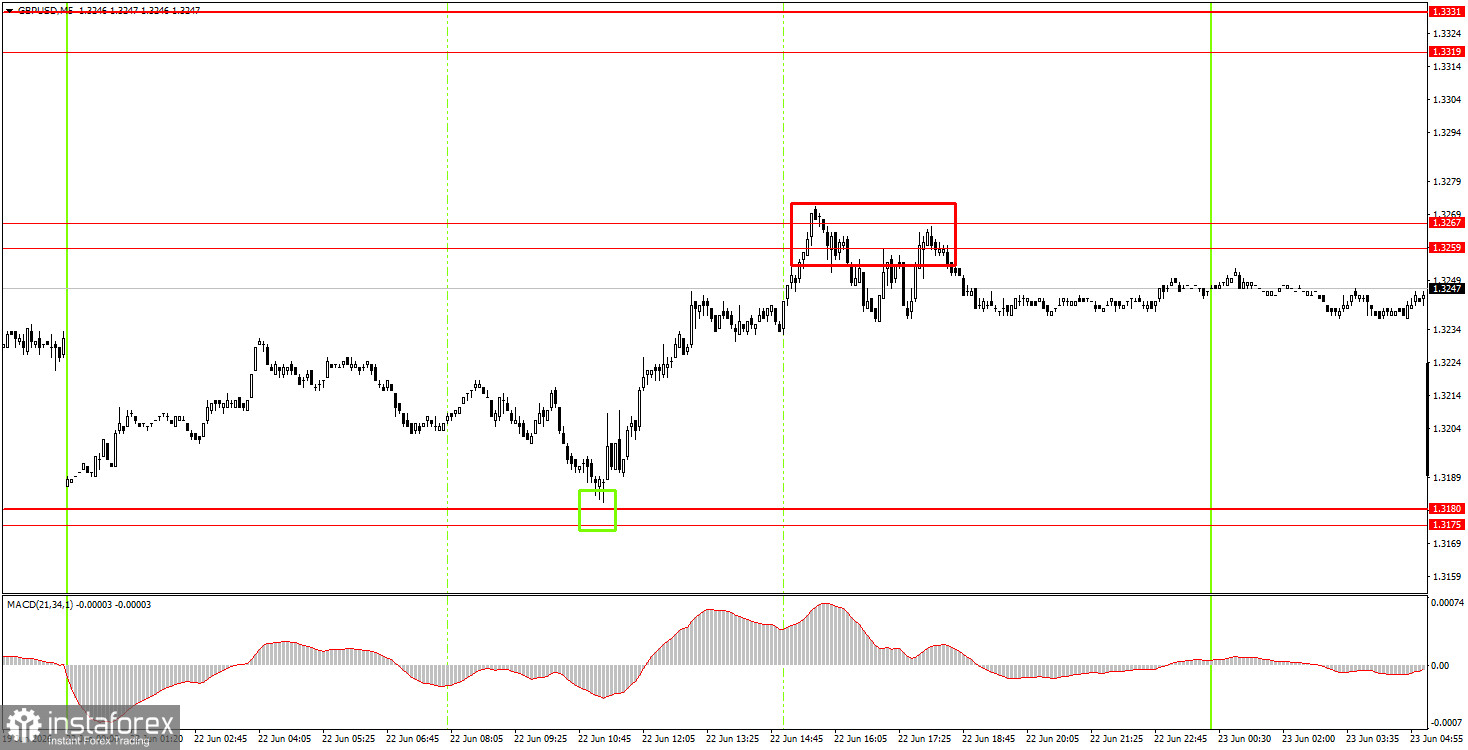
On the 5-minute timeframe on Monday, two trading signals were formed. During the European trading session, the price bounced off the 1.3175-1.3180 area with minimal deviation, creating an opportunity for novice traders to open a simple long position. During the American session, the price reached the 1.3259-1.3267 area, allowing traders to take profits on longs and even open short positions. However, there were no movements in the market by the end of the day.
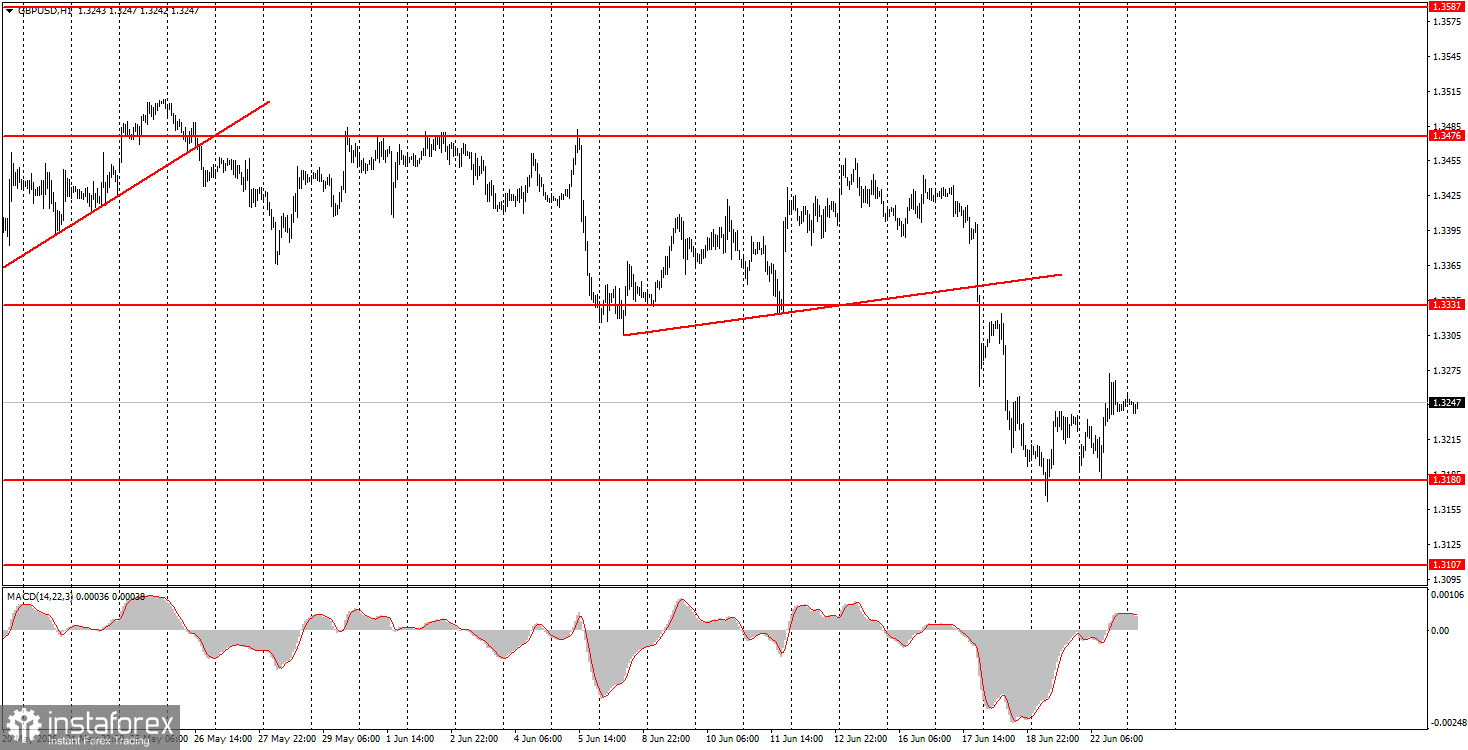
On the hourly timeframe, the GBP/USD pair has exited the sideways channel, but we doubt that the decline will continue for long. Of course, if serious reasons arise for renewed dollar strength, this outcome is possible. However, we do not see such reasons at the moment. The conflict in the Middle East, if not completely resolved, remains on hold; the Federal Reserve has only signaled a possible rate hike by the end of the year, and the political crisis in the UK has become routine.
On Tuesday, novice traders can open shorts targeting 1.3175-1.3180 if the price bounces from the 1.3259-1.3267 area. A price consolidation above the 1.3259-1.3267 area will allow for longs targeting 1.3319-1.3331.
On the 5-minute timeframe, the following levels should be considered for trading: 1.3175-1.3180, 1.3259-1.3267, 1.3319-1.3331, 1.3380-1.3386, 1.3456-1.3476, 1.3587-1.3598, 1.3631-1.3641, 1.3695, and 1.3741-1.3751. On Tuesday, indices of business activity in the services and manufacturing sectors for June are scheduled to be published in the UK and the U.S. The British reports may provoke a slight reaction.
Price levels (areas) of support and resistance are targets when opening long or short positions or sources of signals.
Red lines indicate channels or trend lines that display the current trend and indicate the preferred direction for trading.
The MACD indicator (14,22,3) – histogram and signal line – is a supplementary indicator that can also be used as a source of signals.
Important speeches and reports (contained in the news calendar) can significantly impact the movement of the currency pair. Therefore, during their release, trading should be conducted with maximum caution, or one should exit the market to avoid sharp reversals against preceding movements.
Beginners trading in the forex market should remember that not every trade can be profitable. Developing a clear strategy and practicing money management are key to long-term success in trading.
*La presente analisi del mercato ha un carattere esclusivamente informativo e non rappresenta una guida per l`effettuazione di una transazione.
Le recensioni analitiche di InstaSpot ti renderanno pienamente consapevole delle tendenze del mercato! Essendo un cliente InstaSpot, ti viene fornito un gran numero di servizi gratuiti per il trading efficiente.


