


La leggenda nel team InstaSpot!!
Legenda! Pensi che sia troppo patetico? Ma come dobbiamo chiamare un uomo, che è diventato il primo dell'Asia a vincere il campionato mondiale di scacchi a 18 anni e che è diventato il primo Gran Maestro indiano a 19? Fu l'inizio di un duro cammino verso il titolo di campione del mondo, l'uomo che divenne per sempre una parte della storia di scacchi. Un'altra leggenda nel team InstaSpot!


Il Borussia è una delle squadre di calcio più titolate in Germania, che ha ripetutamente dimostrato ai tifosi che lo spirito di competizione e leadership porta al successo. Fai trading nello stesso modo in cui lo fanno i professionisti dello sport - fiduciosamente e attivamente. Segui il Borussia FC e sii avanti con InstaSpot!

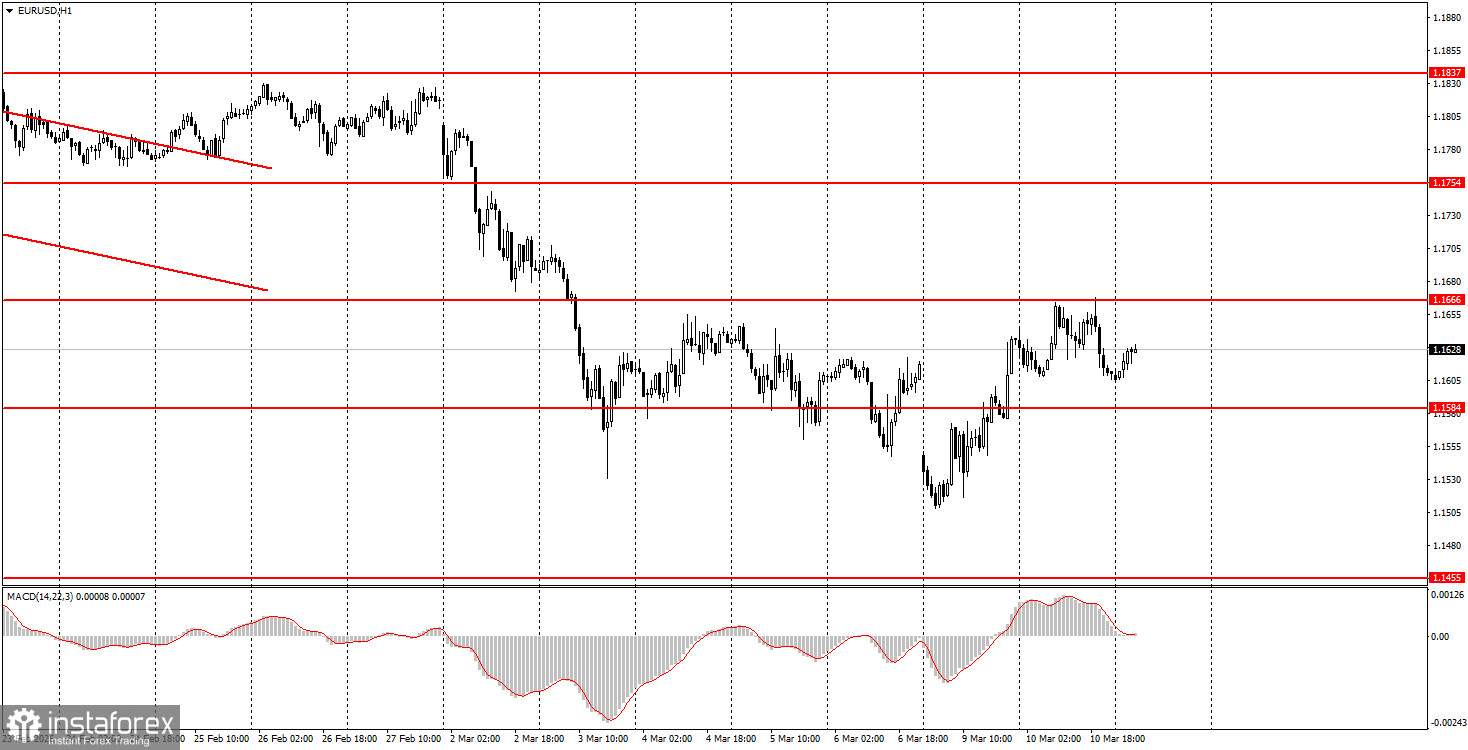
The EUR/USD currency pair continued its upward movement on Tuesday, but the upward momentum remains very weak and may quickly fade. In recent days, the markets have perked up on Trump's statements that the war in Iran may soon end. The U.S. president also announced yesterday that the Strait of Hormuz would be unblocked. As a result, oil prices have dropped, and the dollar has weakened. However, few paid attention to statements from Tehran, which promised to destroy America in response to new missile attacks from Washington and indicated that no barrel of oil would pass through the Strait of Hormuz. Thus, one small step has been taken toward de-escalating the conflict, but many more are needed to fully resolve it. The market remains primed to "buy dollars" and will not hesitate to do so in any dangerous situation.
On the hourly timeframe, the downward trend continues due to the new war in the Middle East. At the beginning of 2026, the long-term upward trend resumed, so we expect a new medium-term rise in the euro. The overall fundamental background remains very challenging for the U.S. dollar, as confirmed by reports on the labor market, GDP, and unemployment. However, at this time, geopolitics remains more important than the economy.
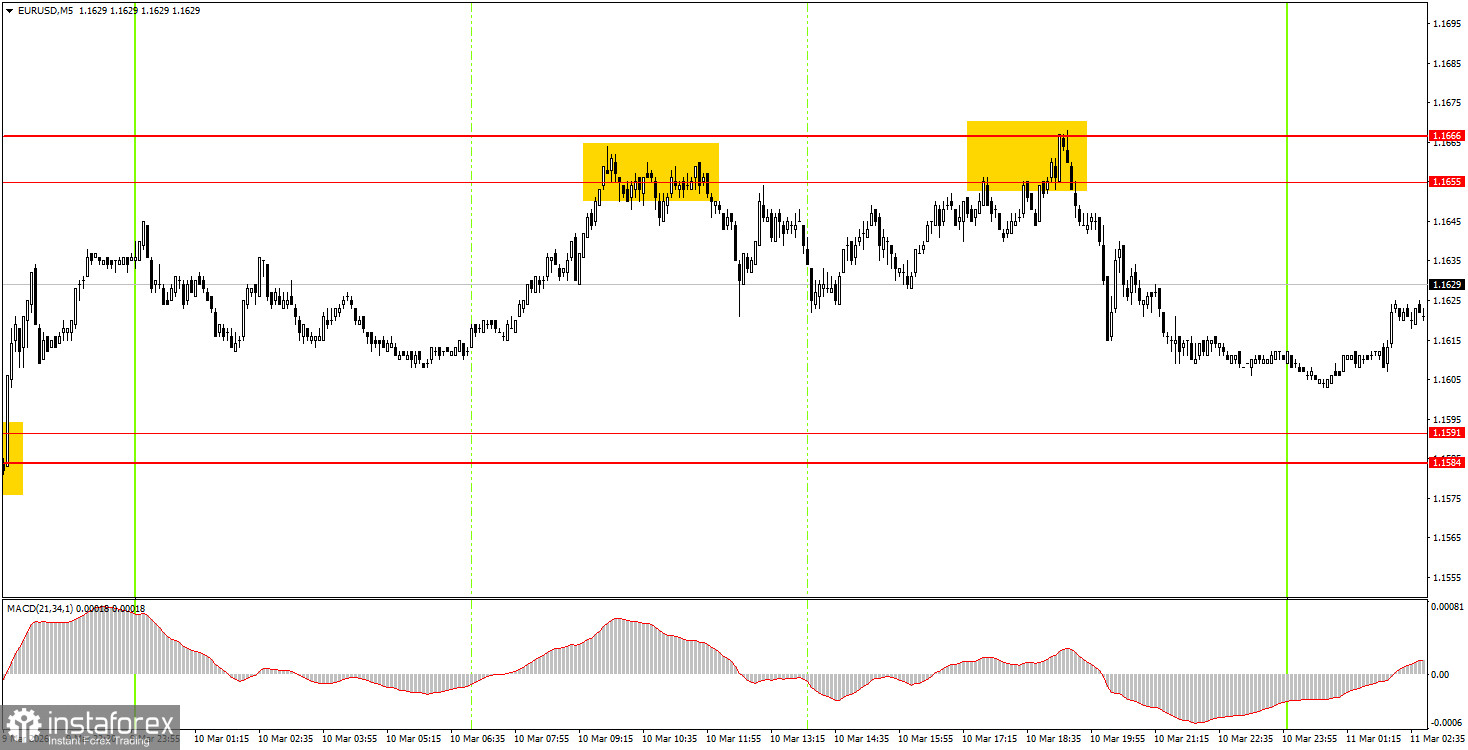
On Wednesday, novice traders may consider short positions if the price consolidates below the 1.1584-1.1591 area or if there is a new bounce from the 1.1655-1.1666 area. A bounce from the 1.1584-1.1591 area will allow for long positions with a target of 1.1655-1.1666.
On the 5-minute timeframe, the following levels should be considered: 1.1354-1.1363, 1.1413, 1.1455-1.1474, 1.1527-1.1531, 1.1584-1.1591, 1.1655-1.1666, 1.1745-1.1754, 1.1830-1.1837, 1.1899-1.1908. On Wednesday, the only significant event is the U.S. Consumer Price Index. This is indeed an important report, but how significant will it be for traders under current circumstances? That's the question... Recently, the market has ignored disappointing data on the labor market, unemployment, and U.S. GDP.
Price levels of support and resistance are levels that serve as targets when opening buys or sells. Take Profit levels can be placed around them.
Red lines represent channels or trend lines that show the current trend and indicate the direction in which it is preferable to trade now.
The MACD indicator (14,22,3) – the histogram and the signal line – is a supporting indicator that can also be used as a source of signals.
Important speeches and reports (always included in the news calendar) can significantly affect the movement of the currency pair. Therefore, during their release, trading should be done with utmost caution, or traders should exit the market to avoid sharp price reversals against the previous movement.
Beginning traders in the forex market should remember that not every trade can be profitable. Developing a clear strategy and effective money management are the keys to long-term trading success.
*La presente analisi del mercato ha un carattere esclusivamente informativo e non rappresenta una guida per l`effettuazione di una transazione.
Le recensioni analitiche di InstaSpot ti renderanno pienamente consapevole delle tendenze del mercato! Essendo un cliente InstaSpot, ti viene fornito un gran numero di servizi gratuiti per il trading efficiente.


