


La leggenda nel team InstaSpot!!
Legenda! Pensi che sia troppo patetico? Ma come dobbiamo chiamare un uomo, che è diventato il primo dell'Asia a vincere il campionato mondiale di scacchi a 18 anni e che è diventato il primo Gran Maestro indiano a 19? Fu l'inizio di un duro cammino verso il titolo di campione del mondo, l'uomo che divenne per sempre una parte della storia di scacchi. Un'altra leggenda nel team InstaSpot!


Il Borussia è una delle squadre di calcio più titolate in Germania, che ha ripetutamente dimostrato ai tifosi che lo spirito di competizione e leadership porta al successo. Fai trading nello stesso modo in cui lo fanno i professionisti dello sport - fiduciosamente e attivamente. Segui il Borussia FC e sii avanti con InstaSpot!

The EUR/USD currency pair declined sharply throughout Monday, as expected. We doubted that the events of Saturday and Sunday in the Middle East would necessarily lead to a rise in the US dollar, but that was quite feasible option. Let us remind you that the market had been preparing for war in the Middle East for the past two weeks, as Donald Trump threatened Iran with massive attacks and the overthrow of the current regime. As it turned out, something went awry for Washington. Instead of a devastating attack aimed at eliminating Iran's leaders and key nuclear and military sites, Washington faced retaliatory strikes on its bases located in more than 10 countries in the Middle East and even Cyprus. Thus, more than 10 states are already involved in the conflict. It seems like a full-scale war rather than a special operation. Since the scale of the conflict clearly exceeded Trump's plans, the dollar was once again widely used as a safe haven on Monday. It is quite possible that the American currency will continue to appreciate this week, as the attempt to initiate an upward trend was thwarted by geopolitics.
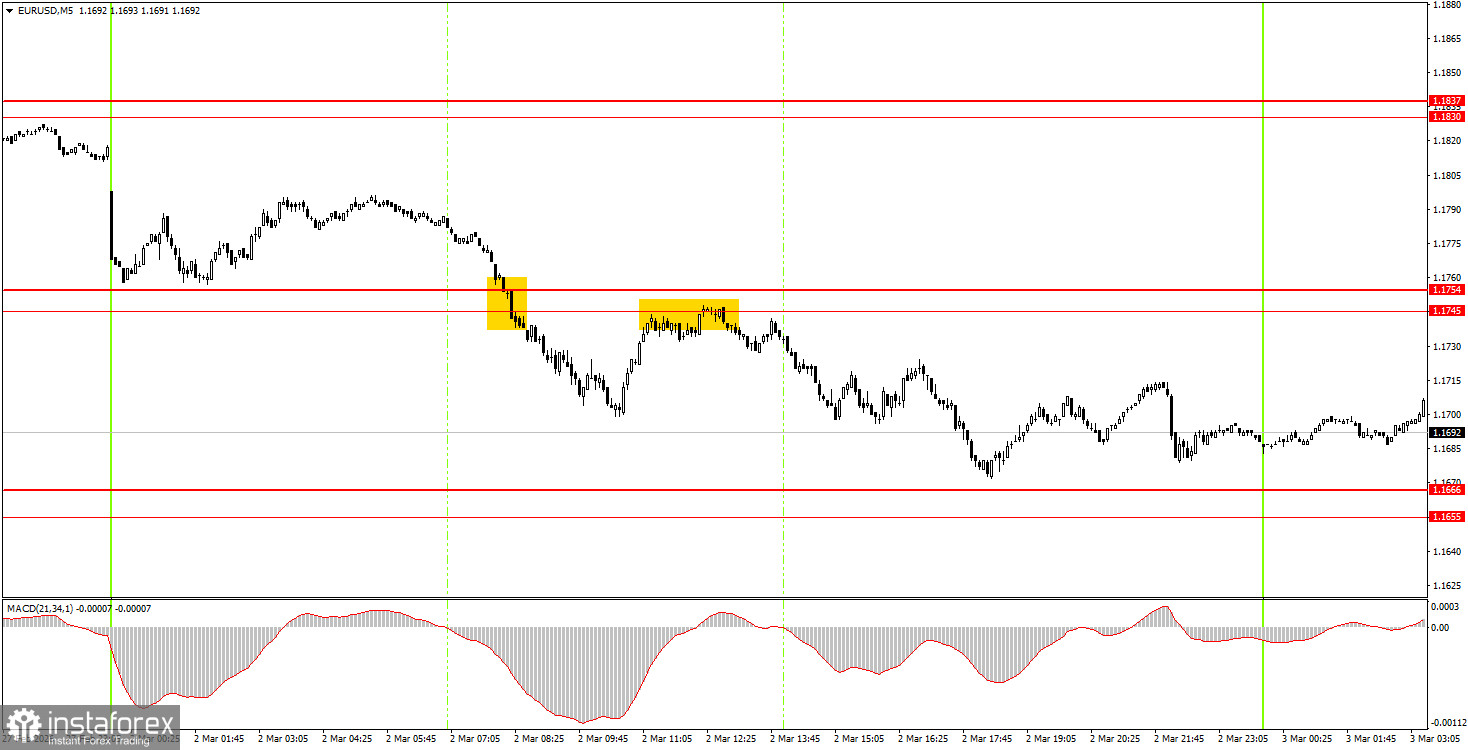
On the 5-minute timeframe, two trading signals were formed on Monday. During the European trading session, the price broke through the 1.1745-1.1754 area and shortly afterward bounced off it from below. Throughout the day, the price approached the nearest target – 1.1666. In any case, the sell trade (first or second – it does not matter) was profitable for beginner traders.
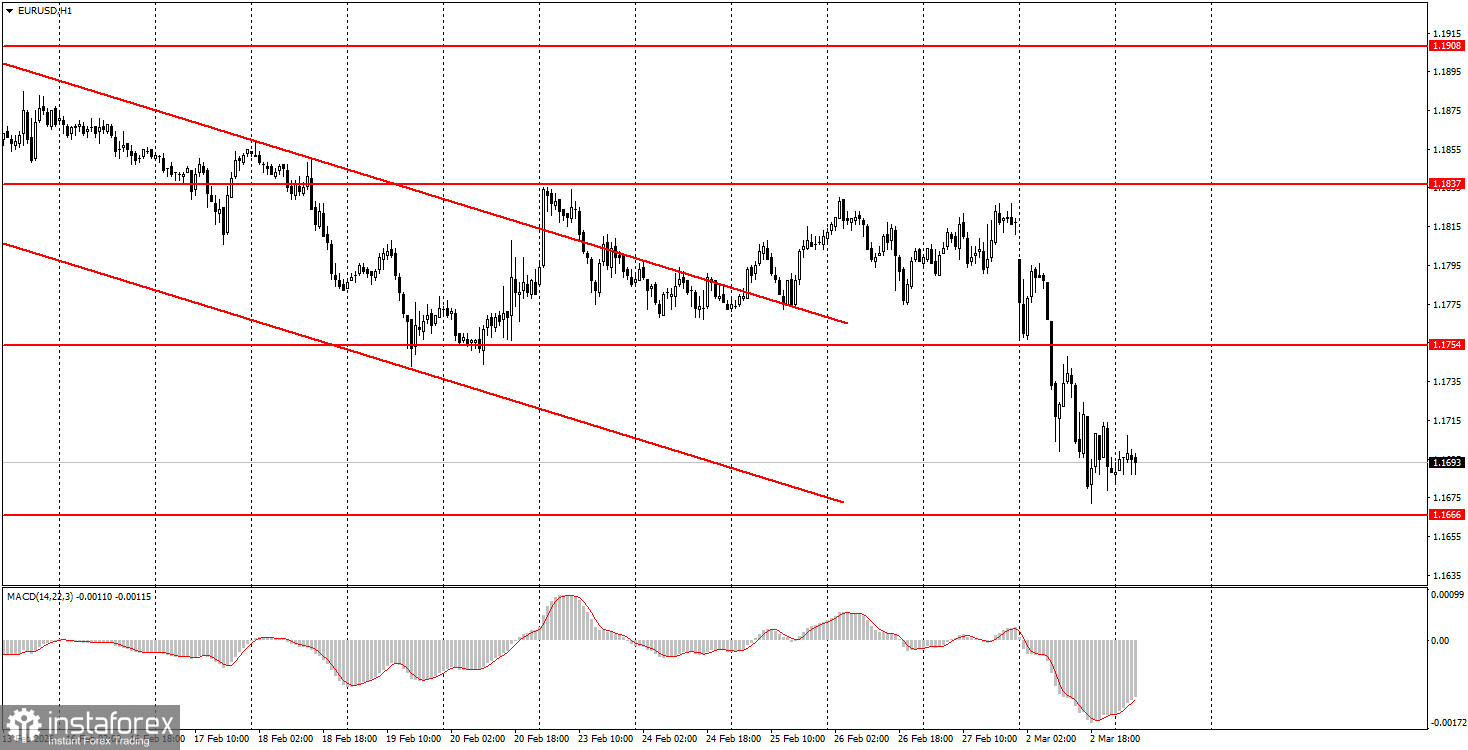
On the hourly timeframe, the downward trend has resumed, but only "thanks" to the new war in the Middle East. At the beginning of 2026, a long-term upward trend resumed, so we expect renewed medium-term growth for the euro. The overall fundamental background remains very challenging for the US currency, so we fully support further upward movement. However, currently, the market's main focus is on geopolitics, not the economy.
On Tuesday, beginner traders can consider short positions if the price settles below the area of 1.1655-1.1666 with a target in the area of 1.1584-1.1591. A bounce from the area of 1.1655-1.1666 will allow opening long positions with a target of 1.1745-1.1754.
On the 5-minute timeframe, levels to consider are 1.1455-1.1474, 1.1527-1.1531, 1.1550, 1.1584-1.1591, 1.1655-1.1666, 1.1745-1.1754, 1.1830-1.1837, 1.1899-1.1908, 1.1970-1.1988, 1.2044-1.2056, 1.2092-1.2104. On Tuesday, a rather important inflation report for February will be published in the European Union. However, whether the market will react to this report is unknown, as much more important and global issues are currently on the agenda.
Price levels of support and resistance are levels that serve as targets when opening buys or sells. Take Profit levels can be placed around them.
Red lines represent channels or trend lines that show the current trend and indicate the direction in which it is preferable to trade now.
The MACD indicator (14,22,3) – the histogram and the signal line – is a supporting indicator that can also be used as a source of signals.
Important speeches and reports (always included in the news calendar) can significantly affect the movement of the currency pair. Therefore, during their release, trading should be done with utmost caution, or traders should exit the market to avoid sharp price reversals against the previous movement.
Beginning traders in the forex market should remember that not every trade can be profitable. Developing a clear strategy and effective money management are the keys to long-term trading success.
*La presente analisi del mercato ha un carattere esclusivamente informativo e non rappresenta una guida per l`effettuazione di una transazione.
Le recensioni analitiche di InstaSpot ti renderanno pienamente consapevole delle tendenze del mercato! Essendo un cliente InstaSpot, ti viene fornito un gran numero di servizi gratuiti per il trading efficiente.


