


Nella nostra squadra ci sono più di 7.000.000 trader! Ogni giorno ci impegniamo a far sì che il trading migliori. Conseguiamo grandi risultati e ci muoviamo in avanti.
Il riconoscimento da parte di milioni di trader in tutto il mondo rappresenta l'alta valutazione della nostra attività! Voi avete fatto la vostra scelta e noi faremo la nostra al fine di soddisfare le vostre aspettative!
Assieme siamo una grande squadra!
InstaSpot. Siamo orgogliosi di lavorare per voi!


Attore, campione del mondo di lotta libera e semplicemente un vero maciste russo! Persona venuta dal nulla. Persona che rispecchia i nostri obiettivi. Il segreto del successo di Taktarov consiste nel mirare continuamente al suo scopo.
Dischiudi anche tu tutti gli aspetti del tuo talento! Impara, prova, sbaglia, ma non fermarti!
InstaSpot - la storia delle tue vittorie inizia qui!

On the hourly chart, GBP/USD has been trading sideways over the past few days between 1.3186 and 1.3240. Movements are weak. A rebound from the 38.2% Fibonacci level at 1.3186 would favor the British pound and push the pair toward the 50.0% corrective level at 1.3240. A consolidation above 1.3240 would increase the probability of further growth toward the next Fibonacci level of 61.8% at 1.3294.
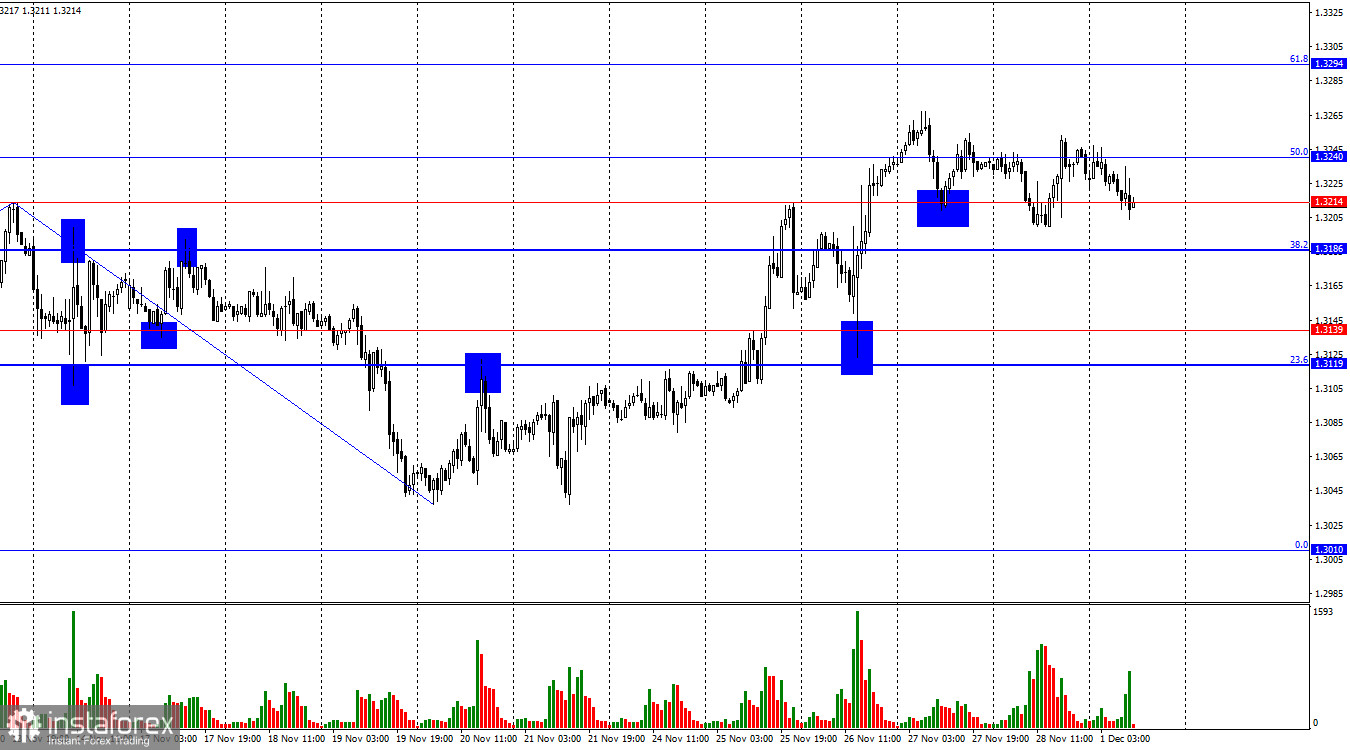
The wave structure has transformed into a "bullish" pattern. The last downward wave did not break the previous low, while the new upward wave surpassed the previous peak. Thus, the trend is now officially "bullish." The information background for the pound has been weak in recent weeks, but the bears have fully exhausted their pressure, and the news from the U.S. has also been lackluster.
On Friday, there was no significant news. This morning, the U.K. released the Manufacturing PMI for November, which came in exactly as traders expected. Later today in the U.S., the important ISM Manufacturing PMI will be released, which could increase trader activity. Overall, the pound has broken its multi-month negative trend, so further gains are expected in the coming weeks. It is worth noting that the next Federal Reserve meeting is scheduled for next week, with a high probability of another 0.25% rate cut. This gives the market reason to continue selling the U.S. dollar. Graphical analysis supports the pound's growth after consolidation above the descending trend channel on the 4-hour chart.
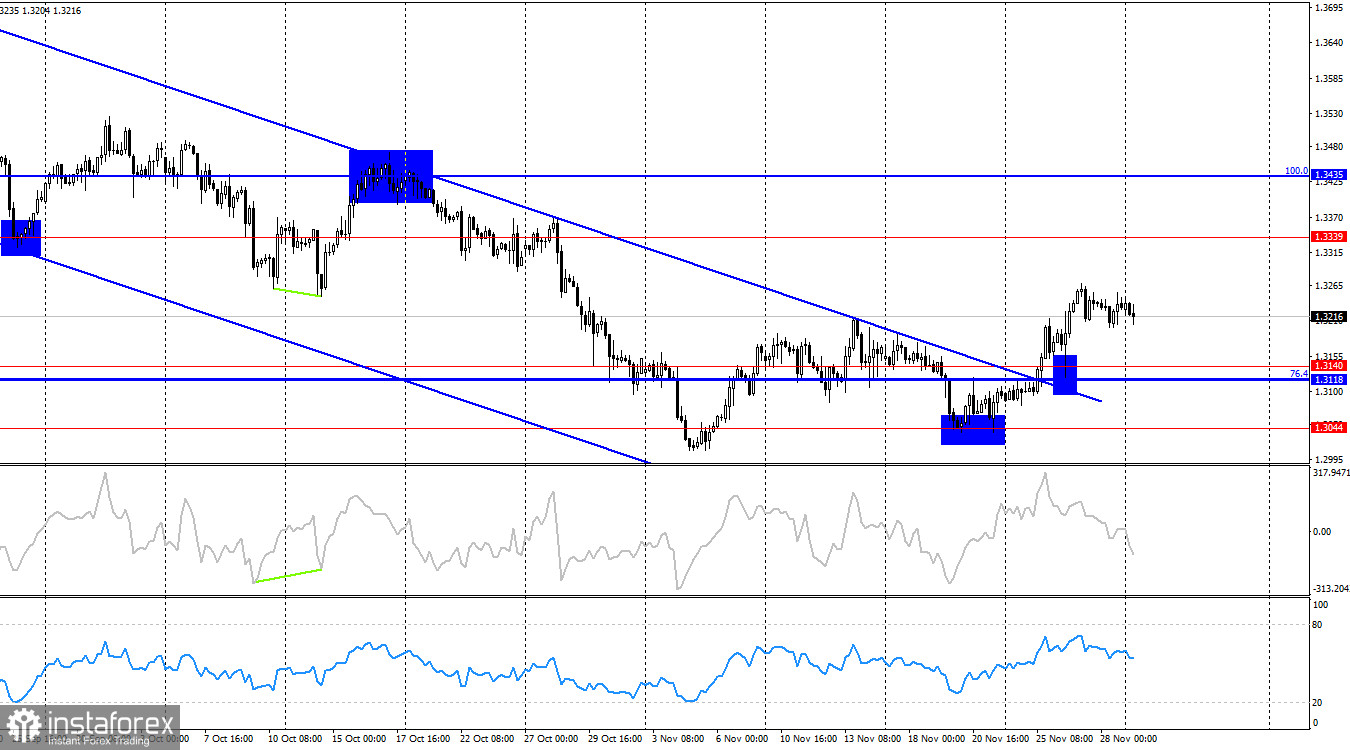
On the 4-hour chart, the pair has consolidated above the descending trend channel and the 1.3118–1.3140 level. Therefore, the upward movement could continue toward 1.3339, with bulls forming the trend. No emerging divergences are observed on any indicators today. A rebound from 1.3339 would favor the U.S. dollar and a partial pullback in the pair.
Commitments of Traders (COT) Report:
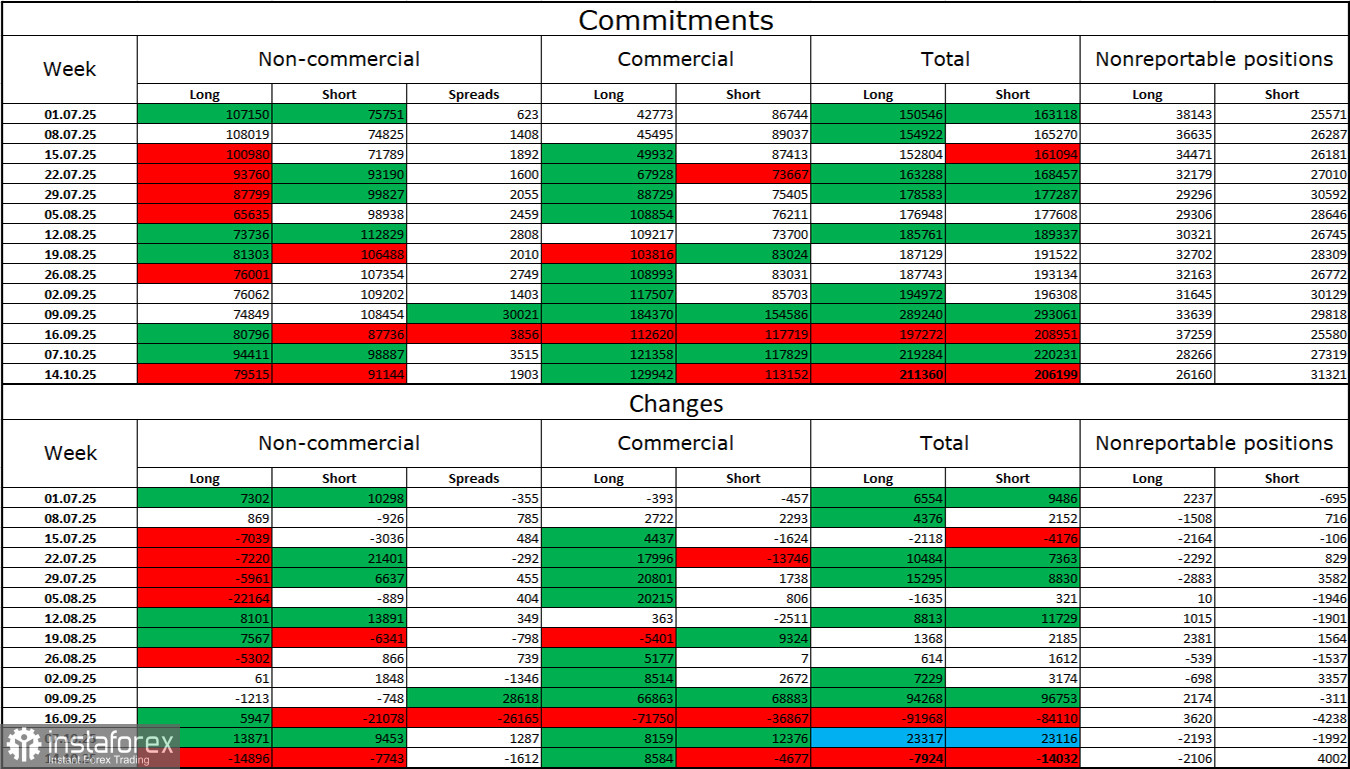
Sentiment among "Non-commercial" traders for the last reporting week has become less bullish, but that reporting week was one and a half months ago — October 14. The number of long positions held by speculators decreased by 14,896, while shorts decreased by 7,743. The current gap between long and short positions is approximately 79,000 versus 91,000. However, these data reflect mid-October positions.
In my view, the pound still appears less "risky" than the dollar. In the short term, the U.S. currency is in demand, but I believe this is temporary. Donald Trump's policies caused a sharp decline in the labor market, and the Fed must ease monetary policy to prevent rising unemployment and stimulate job creation. Therefore, if the Bank of England can cut rates once more, the FOMC may continue easing throughout 2026. The dollar weakened significantly in 2025, and 2026 may not be any better.
Economic Calendar – U.K. and U.S.:
The December 1 economic calendar contains three events, with the ISM index being the most significant. The impact of news on market sentiment on Monday is expected to be moderate, particularly in the afternoon.
GBP/USD Forecast and Trading Advice:
Sell the pair today if prices consolidate below 1.3186 on the hourly chart, targeting 1.3119–1.3139. Buy the pair if prices consolidate above 1.3240 on the hourly chart, targeting 1.3294.
Fibonacci levels are drawn from 1.3470–1.3010 on the hourly chart and from 1.3431–1.2104 on the 4-hour chart.
*La presente analisi del mercato ha un carattere esclusivamente informativo e non rappresenta una guida per l`effettuazione di una transazione.
Le recensioni analitiche di InstaSpot ti renderanno pienamente consapevole delle tendenze del mercato! Essendo un cliente InstaSpot, ti viene fornito un gran numero di servizi gratuiti per il trading efficiente.


