


GBP/USD
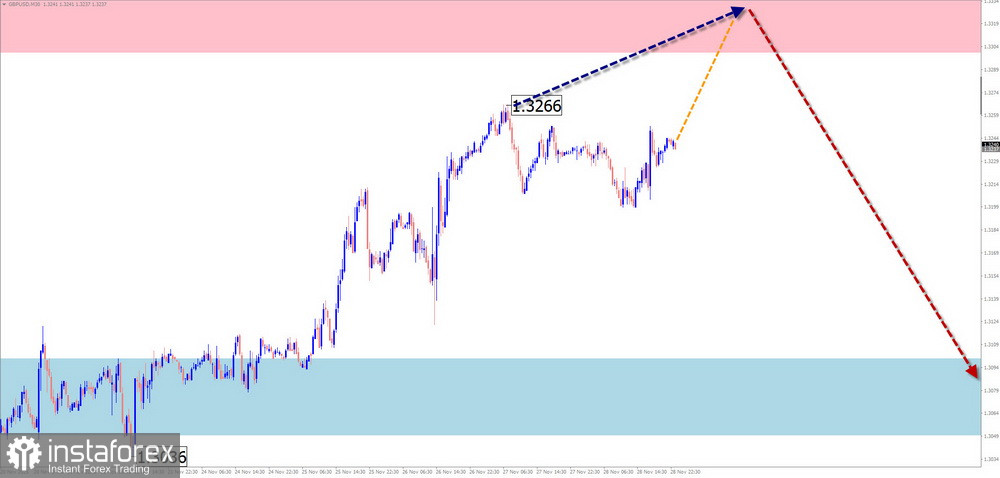
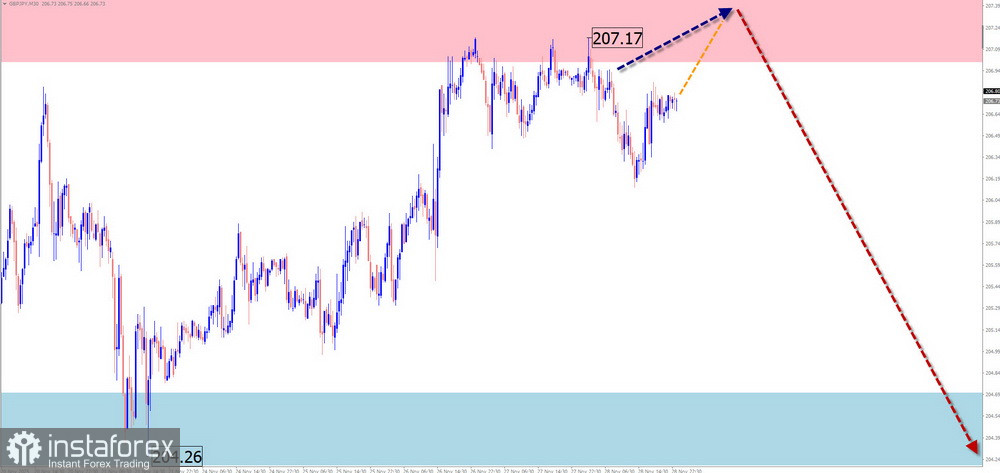
Since the start of the year, the main British pound pair has been forming an upward trend. Within the wave structure, a downward correction has been developing since late April. The structure of the wave does not yet appear complete. The price is approaching the lower boundary of a strong potential reversal zone.
At the beginning of the upcoming week, GBP/USD may come under pressure near the resistance zone. A short-term breakout above the upper boundary is possible. After that, a reversal and a downward move are expected. The support zone marks the most probable lower boundary of the weekly range.
Resistance:
Support:
AUD/USD
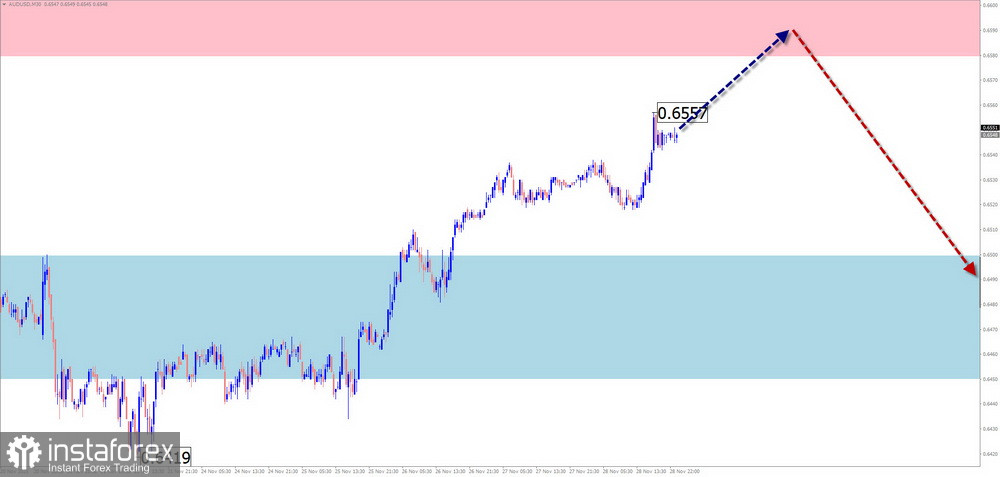
On the daily chart, the upward trend that began in February continues. From the lower boundary of a strong reversal zone, a correction of the final part of the main wave has been forming for the past 1.5 months. Its structure still appears incomplete.
This week, the pair is expected to move within a price corridor between the nearest opposing zones. In the coming days, pressure on the resistance zone is likely, with a potential short-lived breakout above it. A resumption of downward price movement is more likely closer to the weekend.
Resistance:
Support:
USD/CHF
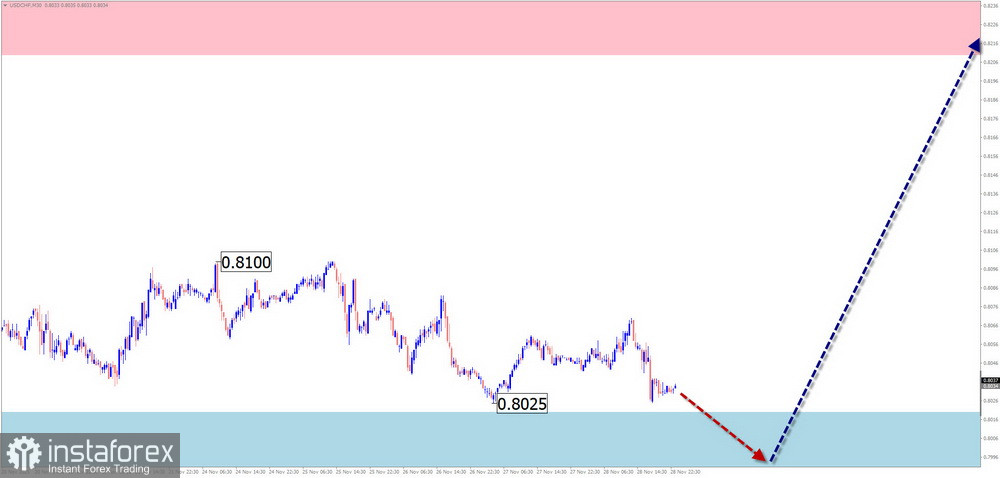
On the USD/CHF chart, an upward wave zigzag has been developing since mid-April. The structure shows the formation of a stretched/contracting flat. The middle part (B) is nearing completion. For several weeks, the price has been moving along a cluster of multiple support/resistance levels on different timeframes.
At the start of the week, pressure on the support zone is likely to continue, with a brief breakout below its lower boundary not excluded. Afterward, a reversal and renewed growth are expected. The resistance zone represents the upper boundary of the anticipated weekly movement.
Resistance:
Support:
EUR/JPY
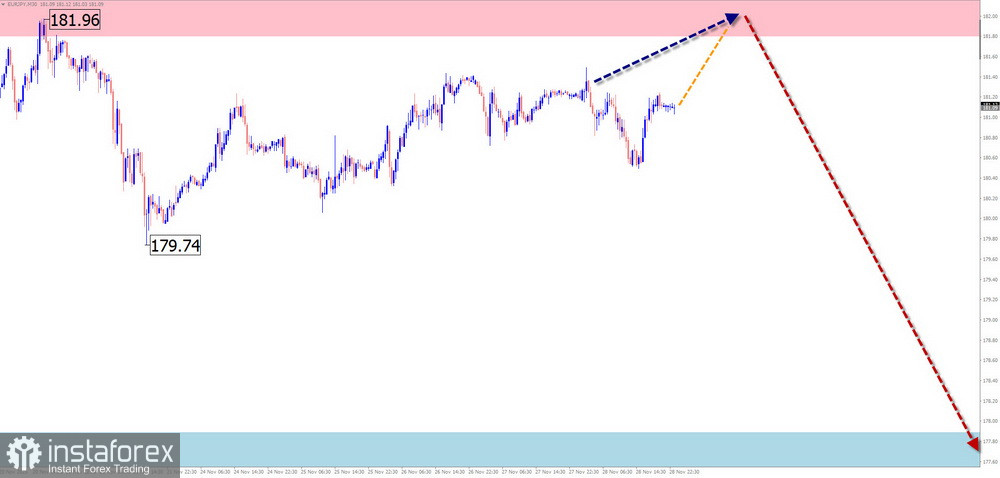
On the weekly chart of the euro–yen cross, the upward trend continues. The price is approaching the lower boundary of a strong potential reversal zone on the largest timeframe. Since November 20, the pair has been moving sideways, forming a correction of the last wave segment. The structure of this movement is not yet complete.
Over the next couple of days, a continuation of the overall sideways movement is expected, mostly with an upward bias. In the second half of the week, a reversal and the beginning of downward movement are anticipated. Volatility and an active phase of decline are likely closer to the weekend.
Resistance:
Support:
GBP/JPY
The upward wave dominating since early August brought the pair into a strong weekly resistance zone. The structure of the final segment appears complete. The downward movement that began two months ago has reversal potential. The wave structure is developing as an irregular flat.
In the first half of the upcoming week, a sideways movement with an upward bias is expected. The price is unlikely to rise beyond the resistance boundaries. After that, activity is likely to increase and the pair may begin a decline toward the projected support levels. The start of active movement may coincide with the release of important economic data.
Resistance:
Support:
EUR/GBP
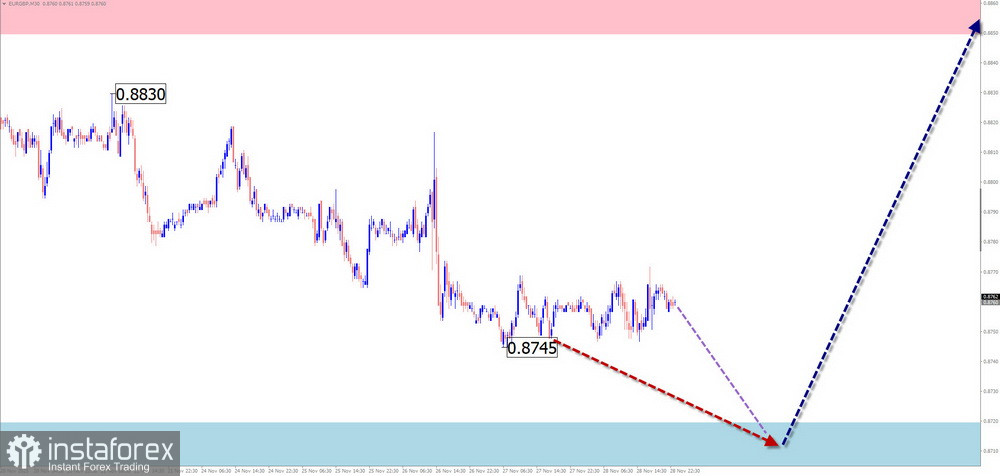
The short-term trend of the euro–pound cross is upward. In the larger wave structure, this segment is part of a correction. The wave structure forms a stretched/contracting flat and is not yet complete.
In the next couple of days, the price will likely continue moving toward the support zone. Afterward, a reversal and renewed bullish sentiment are expected. The resistance zone shows the upper boundary of the pair's maximum projected weekly movement.
Resistance:
Support:
Notes: In Simplified Wave Analysis (SWA), all waves consist of three parts (A–B–C). The last unfinished wave is analyzed on each timeframe. Dashed lines indicate expected movements.
Warning: The wave algorithm does not account for the time duration of the instrument's movements!
*La presente analisi del mercato ha un carattere esclusivamente informativo e non rappresenta una guida per l`effettuazione di una transazione.
Le recensioni analitiche di InstaSpot ti renderanno pienamente consapevole delle tendenze del mercato! Essendo un cliente InstaSpot, ti viene fornito un gran numero di servizi gratuiti per il trading efficiente.


