


Nella nostra squadra ci sono più di 7.000.000 trader! Ogni giorno ci impegniamo a far sì che il trading migliori. Conseguiamo grandi risultati e ci muoviamo in avanti.
Il riconoscimento da parte di milioni di trader in tutto il mondo rappresenta l'alta valutazione della nostra attività! Voi avete fatto la vostra scelta e noi faremo la nostra al fine di soddisfare le vostre aspettative!
Assieme siamo una grande squadra!
InstaSpot. Siamo orgogliosi di lavorare per voi!


Attore, campione del mondo di lotta libera e semplicemente un vero maciste russo! Persona venuta dal nulla. Persona che rispecchia i nostri obiettivi. Il segreto del successo di Taktarov consiste nel mirare continuamente al suo scopo.
Dischiudi anche tu tutti gli aspetti del tuo talento! Impara, prova, sbaglia, ma non fermarti!
InstaSpot - la storia delle tue vittorie inizia qui!

In my morning forecast, I highlighted the 1.1537 level and planned to make market entry decisions based on it. Let's look at the 5-minute chart and analyze what happened there. The pair rose, but fell short by a few points, forming a false breakout around 1.1537, so I had no trades in the first half of the day. The technical outlook for the second half of the day remains unchanged.
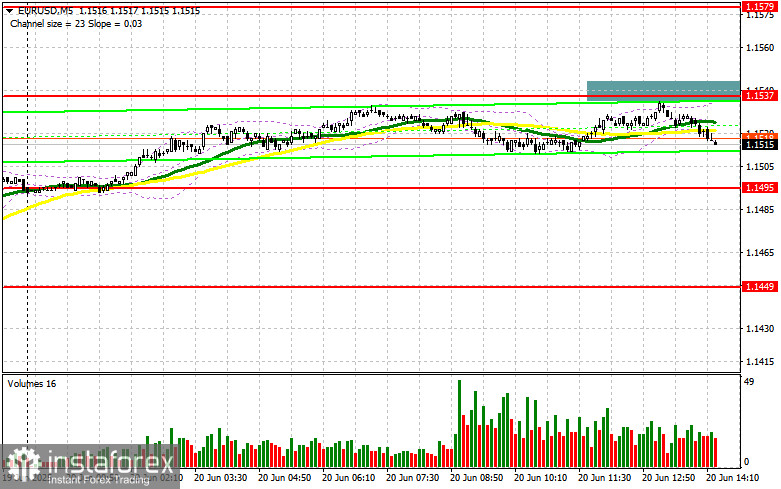
The German Producer Price Index data had little impact on the currency market, which was expected. In the second half of the day, we await the Philadelphia Fed Manufacturing Index and the Leading Indicators Index, but again, no strong volatility is expected. In case of a decline in the euro, I will act near the 1.1495 support level. A false breakout at that level would be a signal to buy EUR/USD, aiming for a recovery and a retest of the 1.1537 resistance, which was not tested earlier in the day. A breakout and retest of this range would confirm a proper entry point with a target at 1.1579. The ultimate target would be 1.1628, where I will take profit. If EUR/USD declines and there is no buying activity around 1.1495, pressure on the pair will increase, potentially driving it down to 1.1449. Only after a false breakout there will I consider buying the euro. I plan to open long positions on a rebound from 1.1408, targeting an intraday correction of 30–35 points.
Sellers did not show much activity in the first half of the day. Hopefully, something interesting will occur during U.S. trading. If there is another attempt to rise, a false breakout around 1.1537 will be a reason to open short positions targeting a decline toward the 1.1495 support level, where the moving averages—which currently favor the bulls—are located. A breakout and consolidation below this range would be a valid sell signal with a move toward 1.1449. The ultimate target would be 1.1408, where I will take profit. If EUR/USD rises further in the second half of the day and bears remain inactive near 1.1537, buyers may push for a larger rally by the end of the week, with a potential breakout of 1.1579. I will only sell there after a failed breakout. I plan to open short positions on a rebound from 1.1628, targeting a 30–35 point downward correction.
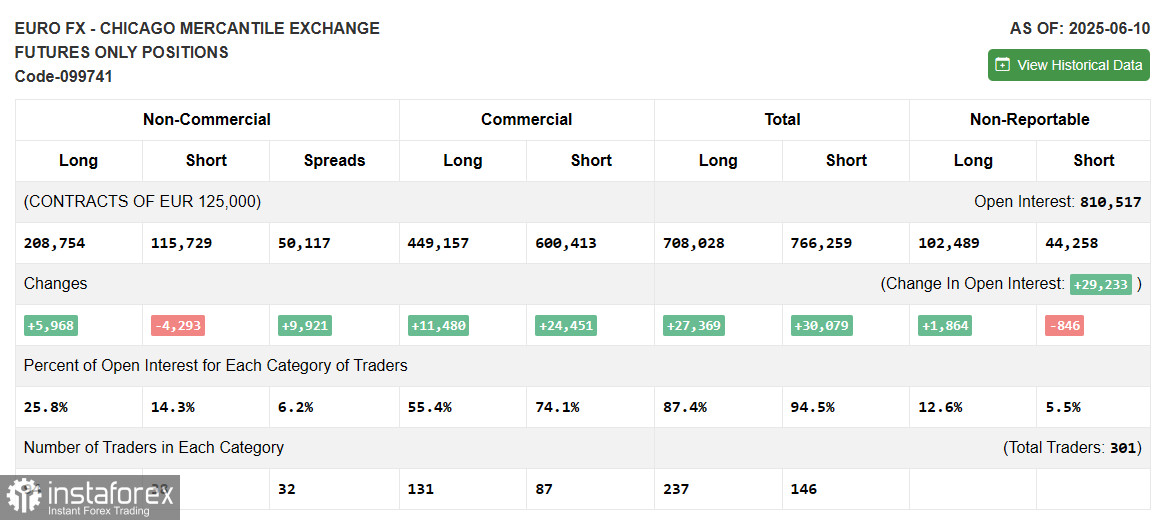
The Commitment of Traders (COT) report for June 10 showed a decrease in short positions and an increase in long ones. The sharp drop in U.S. inflation failed to support the dollar, despite clear indications that the Federal Reserve is likely to keep interest rates unchanged in the near term. What's more important is how Fed Chair Jerome Powell will comment on the inflation situation and what forecasts he will make for rate cuts this fall. This will determine the future direction of the EUR/USD pair, which currently shows no signs of struggling to grow, as confirmed by the report. The COT report indicated that non-commercial long positions increased by 5,968 to 208,754, while non-commercial short positions decreased by 4,293 to 115,729. As a result, the gap between long and short positions widened by 9,921.
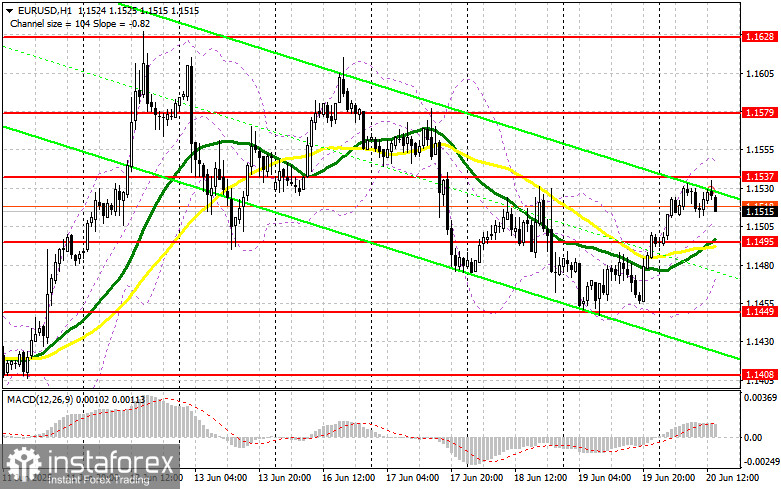
Moving Averages Trading is taking place above the 30- and 50-period moving averages, indicating continued euro growth.
Note: The period and prices of the moving averages are analyzed by the author on the H1 hourly chart and may differ from the classical daily moving averages on the D1 chart.
Bollinger Bands In case of a decline, the lower boundary of the indicator near 1.1465 will act as support.
*La presente analisi del mercato ha un carattere esclusivamente informativo e non rappresenta una guida per l`effettuazione di una transazione.
Le recensioni analitiche di InstaSpot ti renderanno pienamente consapevole delle tendenze del mercato! Essendo un cliente InstaSpot, ti viene fornito un gran numero di servizi gratuiti per il trading efficiente.


