


Nella nostra squadra ci sono più di 7.000.000 trader! Ogni giorno ci impegniamo a far sì che il trading migliori. Conseguiamo grandi risultati e ci muoviamo in avanti.
Il riconoscimento da parte di milioni di trader in tutto il mondo rappresenta l'alta valutazione della nostra attività! Voi avete fatto la vostra scelta e noi faremo la nostra al fine di soddisfare le vostre aspettative!
Assieme siamo una grande squadra!
InstaSpot. Siamo orgogliosi di lavorare per voi!


Attore, campione del mondo di lotta libera e semplicemente un vero maciste russo! Persona venuta dal nulla. Persona che rispecchia i nostri obiettivi. Il segreto del successo di Taktarov consiste nel mirare continuamente al suo scopo.
Dischiudi anche tu tutti gli aspetti del tuo talento! Impara, prova, sbaglia, ma non fermarti!
InstaSpot - la storia delle tue vittorie inizia qui!

On Tuesday, the EUR/USD pair reversed in favor of the euro and rose to the resistance zone of 1.1374–1.1383. A rebound from this zone triggered a decline in favor of the U.S. dollar, with the pair falling back toward the 100.0% Fibonacci retracement level at 1.1265. This marks the sixth consecutive day of range-bound trading between 1.1265 and 1.1383.
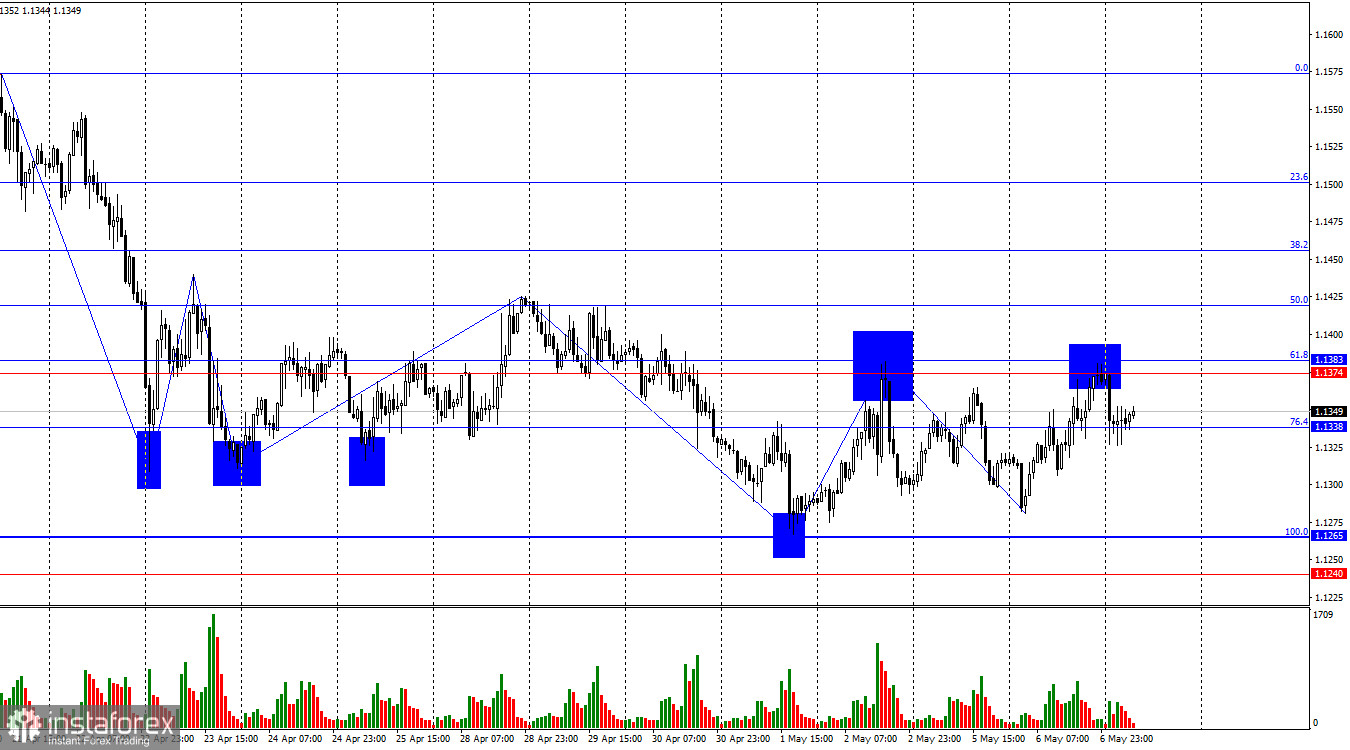
The wave pattern on the hourly chart has shifted. The last completed upward wave did not break the previous peak, and the latest downward wave did not breach the prior low. This confirms a sideways trend. However, this range may be a sign of a trend reversal. Recent waves have been weak and small, indicating low trader activity. News from the White House has been sparse, and traders are waiting for updates on trade negotiations.
Tuesday's news backdrop was weak, both literally and figuratively. Service sector PMI indices in Germany and the Eurozone declined to 49.0 and 50.1, respectively. A drop in business activity warns traders of slowing economic growth. Thus, it's not just the U.S. economy suffering from Trump's trade policies—the Eurozone is starting to feel the pressure too. Yet the EU economy, having shown minimal growth in recent years, has little room left to slow down. A further decline would mean contraction, not just deceleration.
Nonetheless, for traders, the trade war remains the dominant factor. Most other news and data are being ignored. As a result, Tuesday's weak EU data had no noticeable impact on market sentiment. Bulls remained active throughout the day, although limited to the established range. Today, bears may take their turn.
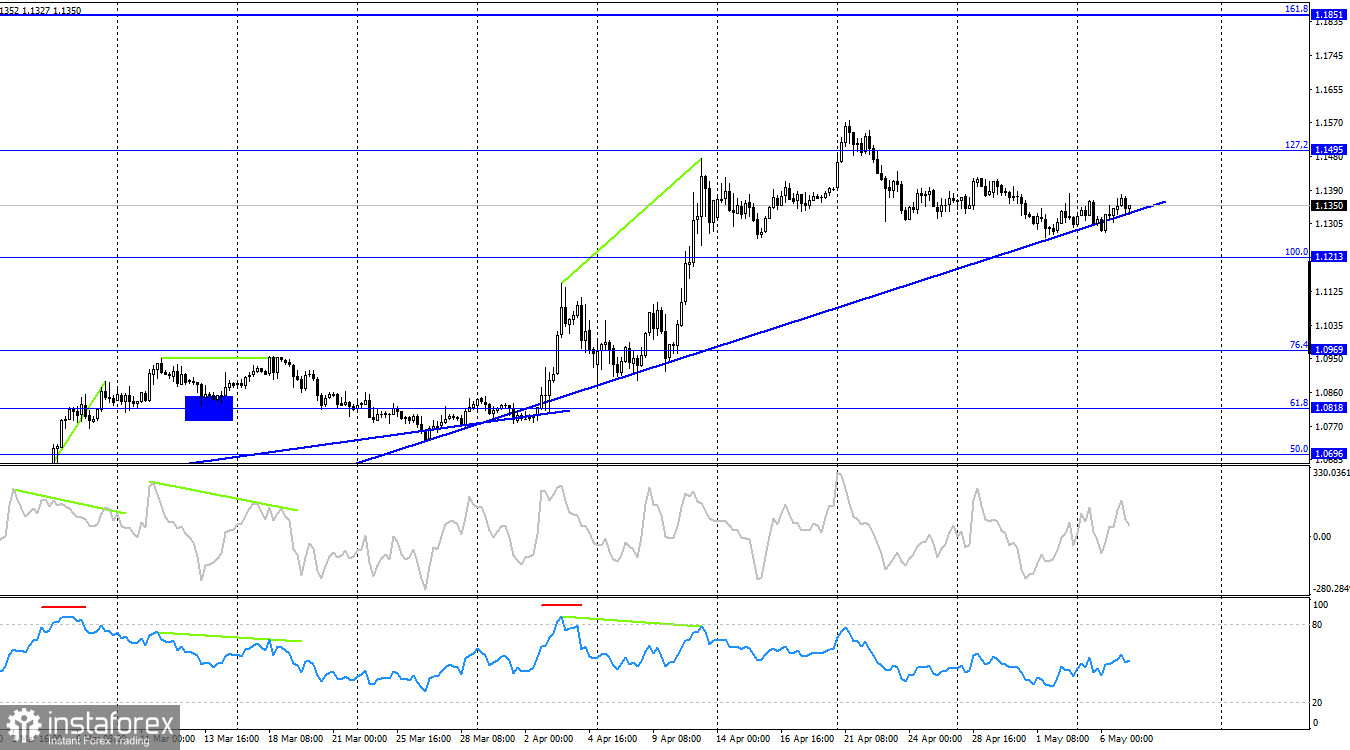
On the 4-hour chart, the pair declined toward the ascending trendline. A rebound from this line would favor the euro and support a renewed rise toward the 127.2% Fibonacci level at 1.1495. A consolidation below the trendline would signal further decline toward the next Fibonacci level of 100.0% at 1.1213. However, for the dollar to strengthen, not only technical signals but also strong fundamental drivers—preferably from Trump—are needed. Currently, no divergences are forming on any indicator.
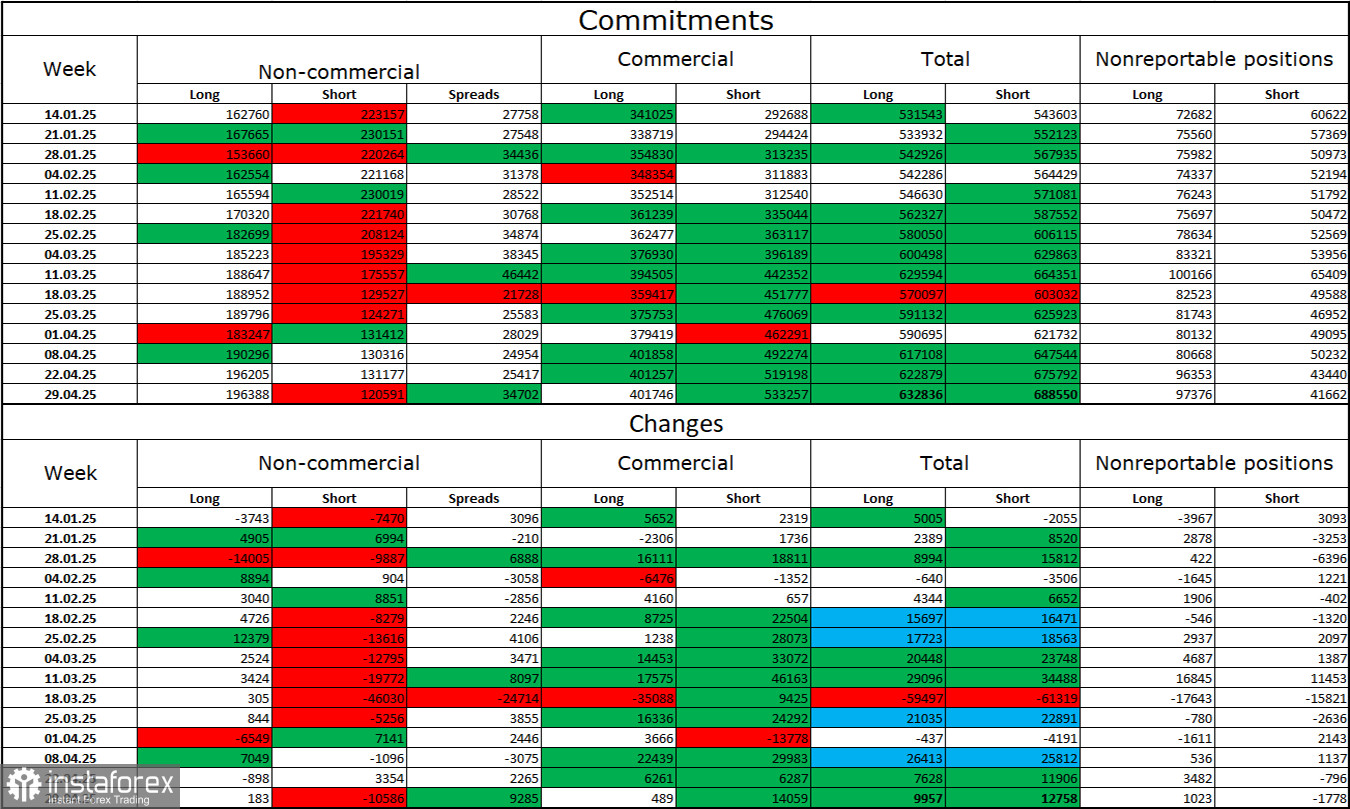
Over the latest reporting week, professional traders opened 183 new long positions and closed 10,586 short ones. The sentiment among the "Non-commercial" group has firmly returned to bullish—thanks to Donald Trump. Total long positions held by speculators now stand at 196,000 versus 120,000 short positions. Just a few months ago, the situation was reversed.
For twenty consecutive weeks, large players had been selling off the euro, but for the past twelve weeks, they've been reducing shorts and increasing longs. While the interest rate differential between the ECB and the Fed still favors the dollar, Trump's policy outlook is now a bigger influence. His stance could push the FOMC toward a dovish approach and even trigger a U.S. recession, according to market expectations.
Key Economic Events (May 7)
Two out of three key releases are especially important for the U.S. dollar. News-related volatility may significantly influence the market in the second half of the day. Tariff news also remains a powerful market driver.
EUR/USD Forecast and Trading Tips
Sell positions were possible yesterday on a rebound from 1.1374 on the hourly chart, targeting 1.1265. Today, stop losses for these trades can be moved to breakeven, and positions can be held further. Buy positions may be considered upon a rebound from 1.1265 with a target of 1.1374, or upon a close above 1.1383.
Fibonacci Grids:
*La presente analisi del mercato ha un carattere esclusivamente informativo e non rappresenta una guida per l`effettuazione di una transazione.
Le recensioni analitiche di InstaSpot ti renderanno pienamente consapevole delle tendenze del mercato! Essendo un cliente InstaSpot, ti viene fornito un gran numero di servizi gratuiti per il trading efficiente.


