


Nella nostra squadra ci sono più di 7.000.000 trader! Ogni giorno ci impegniamo a far sì che il trading migliori. Conseguiamo grandi risultati e ci muoviamo in avanti.
Il riconoscimento da parte di milioni di trader in tutto il mondo rappresenta l'alta valutazione della nostra attività! Voi avete fatto la vostra scelta e noi faremo la nostra al fine di soddisfare le vostre aspettative!
Assieme siamo una grande squadra!
InstaSpot. Siamo orgogliosi di lavorare per voi!


Attore, campione del mondo di lotta libera e semplicemente un vero maciste russo! Persona venuta dal nulla. Persona che rispecchia i nostri obiettivi. Il segreto del successo di Taktarov consiste nel mirare continuamente al suo scopo.
Dischiudi anche tu tutti gli aspetti del tuo talento! Impara, prova, sbaglia, ma non fermarti!
InstaSpot - la storia delle tue vittorie inizia qui!

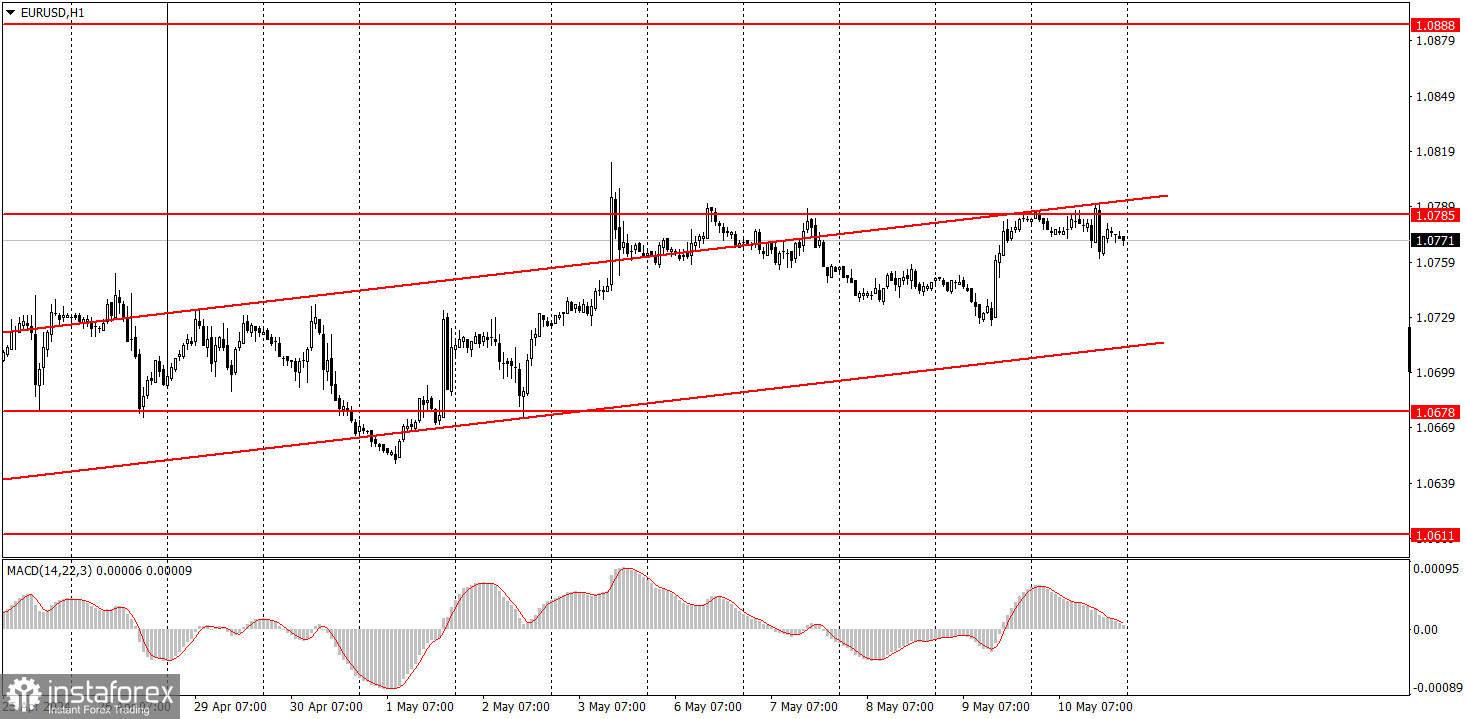
EUR/USD did not show any interesting movement on Friday. The price moved sideways, and volatility was just 30 pips. The pair is still within the ascending channel, which shows that the bullish correction remains intact. This correction has been persistent for over three weeks now, and it should have ended a long time ago. However, first, the US kept releasing weak reports (as if it were better in Europe...), then the market interpreted the Bank of England's meeting results as hawkish (although this is not entirely true), and so the euro appreciated alongside the pound. Once again, there are questions regarding the logic behind these movements. Clearly, the euro should be falling, as there's a 90% chance that the European Central Bank is likely to lower the key rate next month. But until we can guarantee that the price has firmly settled below the ascending channel, we cannot talk about the end of the correction.
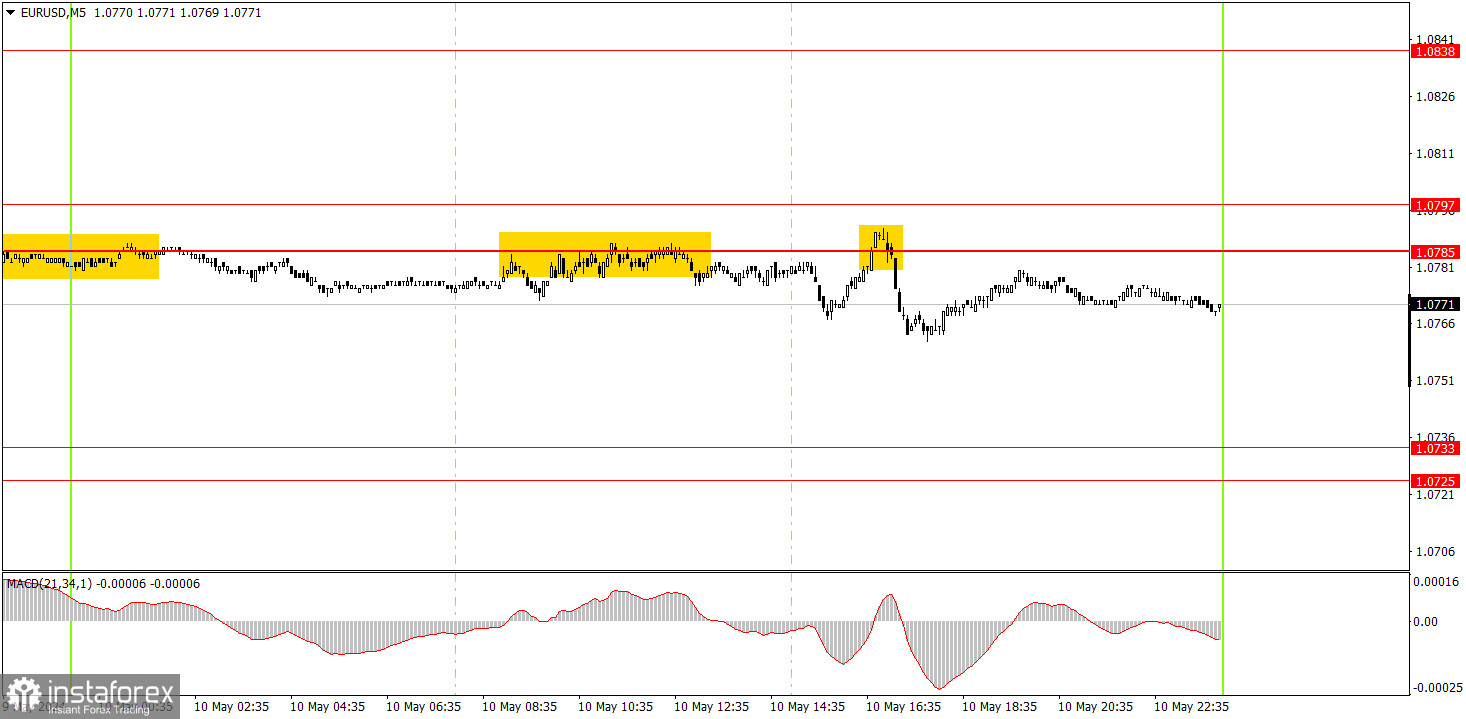
On the 5-minute timeframe, the price bounced from the area of 1.0785-1.0797 twice . The maximum profit that novice traders could expect was about 15 pips during the US trading session. Traders could gain this amount of profit if the trade was manually closed at the lowest point of the price. Sell signals duplicated each other, so only one trade should have been opened.
On the hourly chart, the EUR/USD pair continues to go through a corrective phase. We believe that the decline should resume in the medium term, as the euro remains expensive, and in general, the global trend is pointing downwards. The fundamental background still supports the US dollar, and the recent FOMC meeting proved this - now Federal Reserve Chair Jerome Powell doesn't even know when monetary policy easing will begin.
On Monday, we advise novice traders to closely monitor the area between 1.0785-1.0797. Traders may consider selling the pair if the price rebounds from this area, after that they can aim for 1.0725-1.0733. A breakthrough will allow traders to consider buying with 1.0838-1.0856 as the target.
The key levels on the 5M chart are 1.0483, 1.0526, 1.0568, 1.0611, 1.0678, 1.0725-1.0733, 1.0785-1.0797, 1.0838-1.0856, 1.0888-1.0896, 1.0940, 1.0971-1.0981. On Monday, there are no interesting events scheduled in the European Union and the United States. We may just see another "fun" and "volatile" day, which has been the case 4 out of 5 times lately.
1) Signal strength is determined by the time taken for its formation (either a bounce or level breach). A shorter formation time indicates a stronger signal.
2) If two or more trades around a certain level are initiated based on false signals, subsequent signals from that level should be disregarded.
3) In a flat market, any currency pair can produce multiple false signals or none at all. In any case, the flat trend is not the best condition for trading.
4) Trading activities are confined between the onset of the European session and mid-way through the U.S. session, after which all open trades should be manually closed.
5) On the 30-minute timeframe, trades based on MACD signals are only advisable amidst substantial volatility and an established trend, confirmed either by a trendline or trend channel.
6) If two levels lie closely together (ranging from 5 to 15 pips apart), they should be considered as a support or resistance zone.
Support and Resistance price levels can serve as targets when buying or selling. You can place Take Profit levels near them.
Red lines represent channels or trend lines, depicting the current market trend and indicating the preferable trading direction.
The MACD(14,22,3) indicator, encompassing both the histogram and signal line, acts as an auxiliary tool and can also be used as a signal source.
Significant speeches and reports (always noted in the news calendar) can profoundly influence the price dynamics. Hence, trading during their release calls for heightened caution. It may be reasonable to exit the market to prevent abrupt price reversals against the prevailing trend.
Beginning traders should always remember that not every trade will yield profit. Establishing a clear strategy coupled with sound money management is the cornerstone of sustained trading success.
*La presente analisi del mercato ha un carattere esclusivamente informativo e non rappresenta una guida per l`effettuazione di una transazione.
Le recensioni analitiche di InstaSpot ti renderanno pienamente consapevole delle tendenze del mercato! Essendo un cliente InstaSpot, ti viene fornito un gran numero di servizi gratuiti per il trading efficiente.


