


Nella nostra squadra ci sono più di 7.000.000 trader! Ogni giorno ci impegniamo a far sì che il trading migliori. Conseguiamo grandi risultati e ci muoviamo in avanti.
Il riconoscimento da parte di milioni di trader in tutto il mondo rappresenta l'alta valutazione della nostra attività! Voi avete fatto la vostra scelta e noi faremo la nostra al fine di soddisfare le vostre aspettative!
Assieme siamo una grande squadra!
InstaSpot. Siamo orgogliosi di lavorare per voi!


Attore, campione del mondo di lotta libera e semplicemente un vero maciste russo! Persona venuta dal nulla. Persona che rispecchia i nostri obiettivi. Il segreto del successo di Taktarov consiste nel mirare continuamente al suo scopo.
Dischiudi anche tu tutti gli aspetti del tuo talento! Impara, prova, sbaglia, ma non fermarti!
InstaSpot - la storia delle tue vittorie inizia qui!

On Wednesday, EUR/USD went through low volatility and maintained a weak upward trend as indicated by the ascending channel. Throughout the day, traders could only focus on the US report on durable goods orders; however, the value of this indicator and its derivatives almost coincided with experts' forecasts. Therefore, the market had nothing to react to—it anticipated and worked out the report in advance.
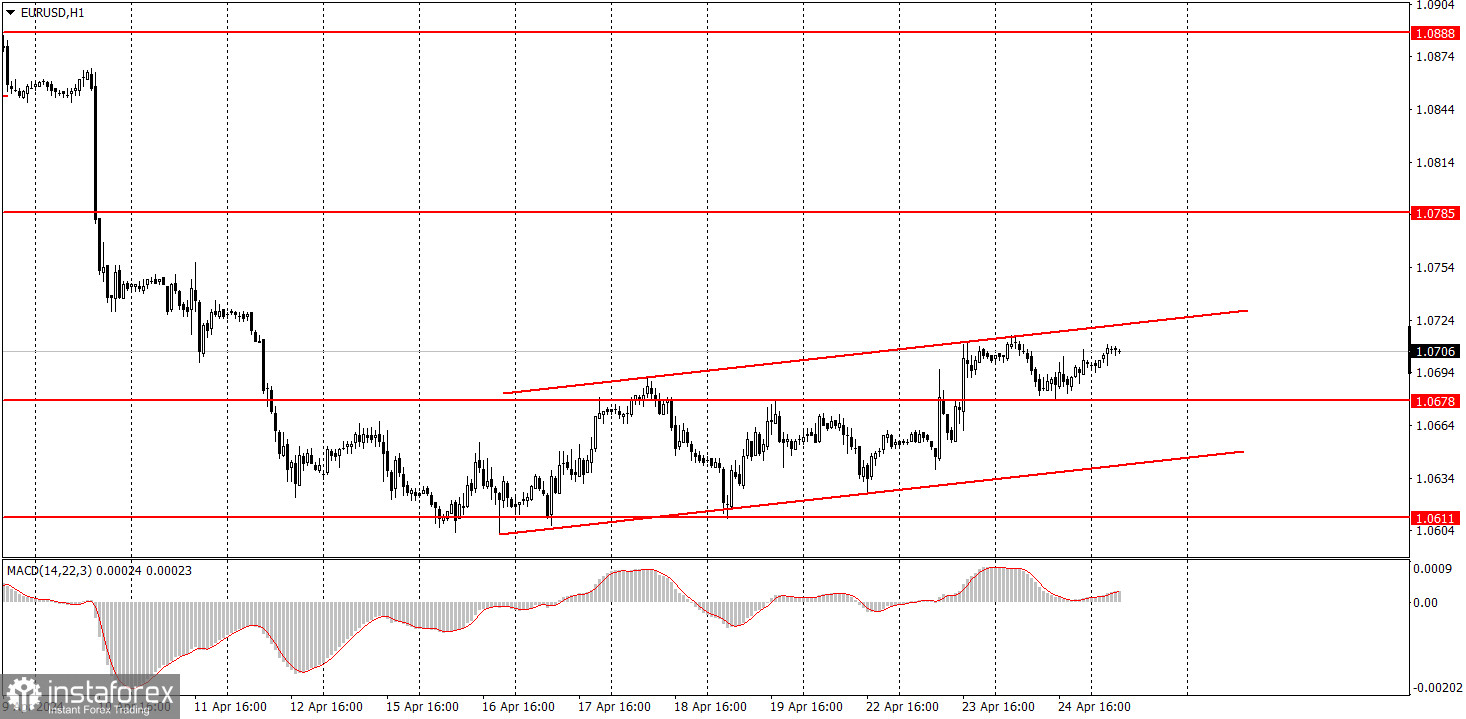
Therefore, the euro continues to correct higher. There is nothing strange about this —the downward trend persists, and from time to time, we should expect upward retracements. The question is when this movement will end and when the main trend will resume. This will be determined by the price consolidating below the ascending channel. Since the price is currently near the upper line, we can expect it to fall to the lower line in the coming days.
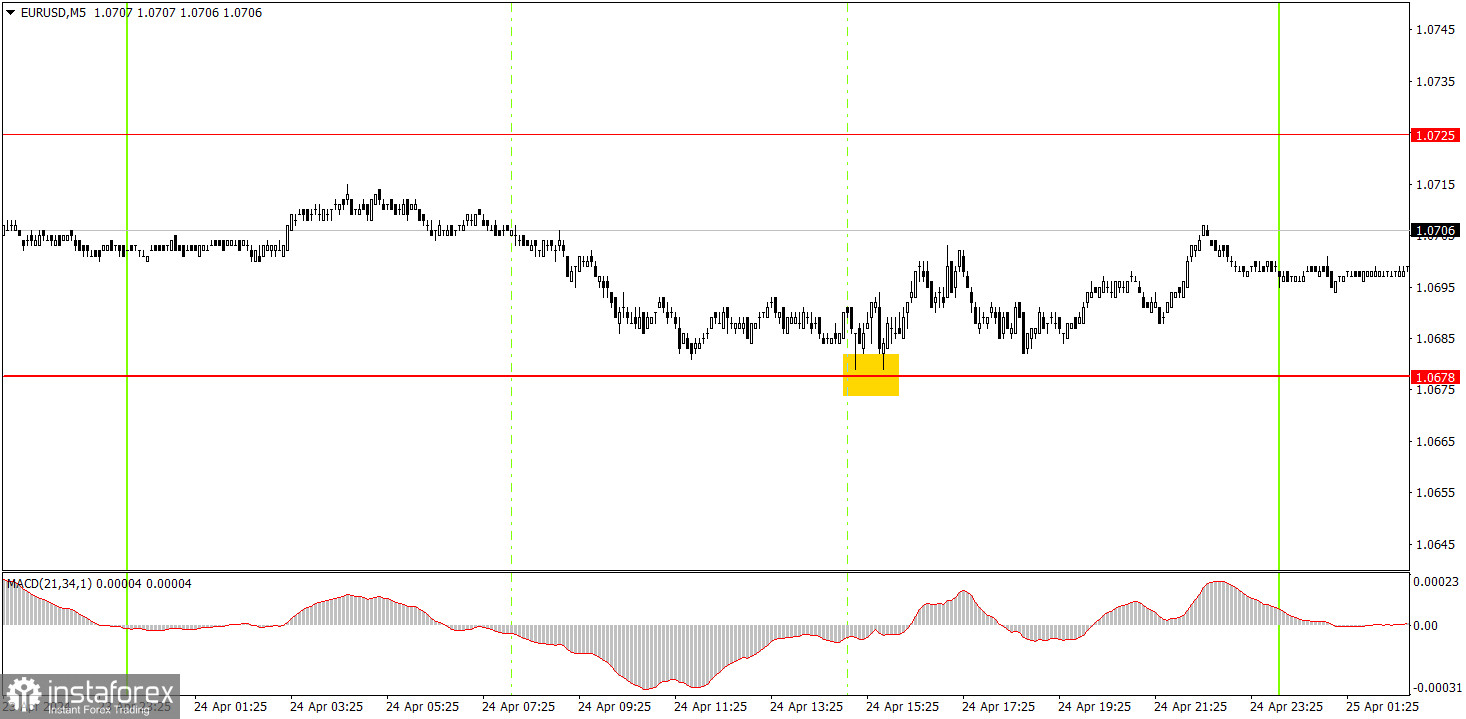
Only one trading signal was generated on the 5-minute timeframe. The price bounced off the level of 1.0678, afterwards it managed to move up by about 15 pips. Novice traders could gain profit if they manually closed the trade since no other signals were formed. Volatility was very low, so a 15-pip profit is still a good result.
On the hourly chart, the downtrend persists, but the EUR/USD pair is currently correcting higher. We believe that the euro should fall further, as it is still too high, and in general, the trend is headed downwards. However, at the moment, the market is likely taking a break before it starts a new downward movement.
Today, the pair may fall as it is currently near the upper boundary of the channel. The only thing that could hinder it is the US GDP report, which will be released at the beginning of the US session. If this report turns out to be weak, the euro may rise further, but its medium-term prospects will not change.
The key levels on the 5M chart are 1.0483, 1.0526, 1.0568, 1.0611, 1.0678, 1.0725, 1.0785-1.0797, 1.0838-1.0856, 1.0888-1.0896, 1.0940, 1.0971-1.0981. On Thursday, there are no significant events scheduled in the EU. Market participants will focus on the US GDP report. The economy is expected to grow by 2.5%. Any value above this will exert pressure on the pair.
1) Signal strength is determined by the time taken for its formation (either a bounce or level breach). A shorter formation time indicates a stronger signal.
2) If two or more trades around a certain level are initiated based on false signals, subsequent signals from that level should be disregarded.
3) In a flat market, any currency pair can produce multiple false signals or none at all. In any case, the flat trend is not the best condition for trading.
4) Trading activities are confined between the onset of the European session and mid-way through the U.S. session, after which all open trades should be manually closed.
5) On the 30-minute timeframe, trades based on MACD signals are only advisable amidst substantial volatility and an established trend, confirmed either by a trendline or trend channel.
6) If two levels lie closely together (ranging from 5 to 15 pips apart), they should be considered as a support or resistance zone.
Support and Resistance price levels can serve as targets when buying or selling. You can place Take Profit levels near them.
Red lines represent channels or trend lines, depicting the current market trend and indicating the preferable trading direction.
The MACD(14,22,3) indicator, encompassing both the histogram and signal line, acts as an auxiliary tool and can also be used as a signal source.
Significant speeches and reports (always noted in the news calendar) can profoundly influence the price dynamics. Hence, trading during their release calls for heightened caution. It may be reasonable to exit the market to prevent abrupt price reversals against the prevailing trend.
Beginning traders should always remember that not every trade will yield profit. Establishing a clear strategy coupled with sound money management is the cornerstone of sustained trading success.
*La presente analisi del mercato ha un carattere esclusivamente informativo e non rappresenta una guida per l`effettuazione di una transazione.
Le recensioni analitiche di InstaSpot ti renderanno pienamente consapevole delle tendenze del mercato! Essendo un cliente InstaSpot, ti viene fornito un gran numero di servizi gratuiti per il trading efficiente.


