


Nella nostra squadra ci sono più di 7.000.000 trader! Ogni giorno ci impegniamo a far sì che il trading migliori. Conseguiamo grandi risultati e ci muoviamo in avanti.
Il riconoscimento da parte di milioni di trader in tutto il mondo rappresenta l'alta valutazione della nostra attività! Voi avete fatto la vostra scelta e noi faremo la nostra al fine di soddisfare le vostre aspettative!
Assieme siamo una grande squadra!
InstaSpot. Siamo orgogliosi di lavorare per voi!


Attore, campione del mondo di lotta libera e semplicemente un vero maciste russo! Persona venuta dal nulla. Persona che rispecchia i nostri obiettivi. Il segreto del successo di Taktarov consiste nel mirare continuamente al suo scopo.
Dischiudi anche tu tutti gli aspetti del tuo talento! Impara, prova, sbaglia, ma non fermarti!
InstaSpot - la storia delle tue vittorie inizia qui!

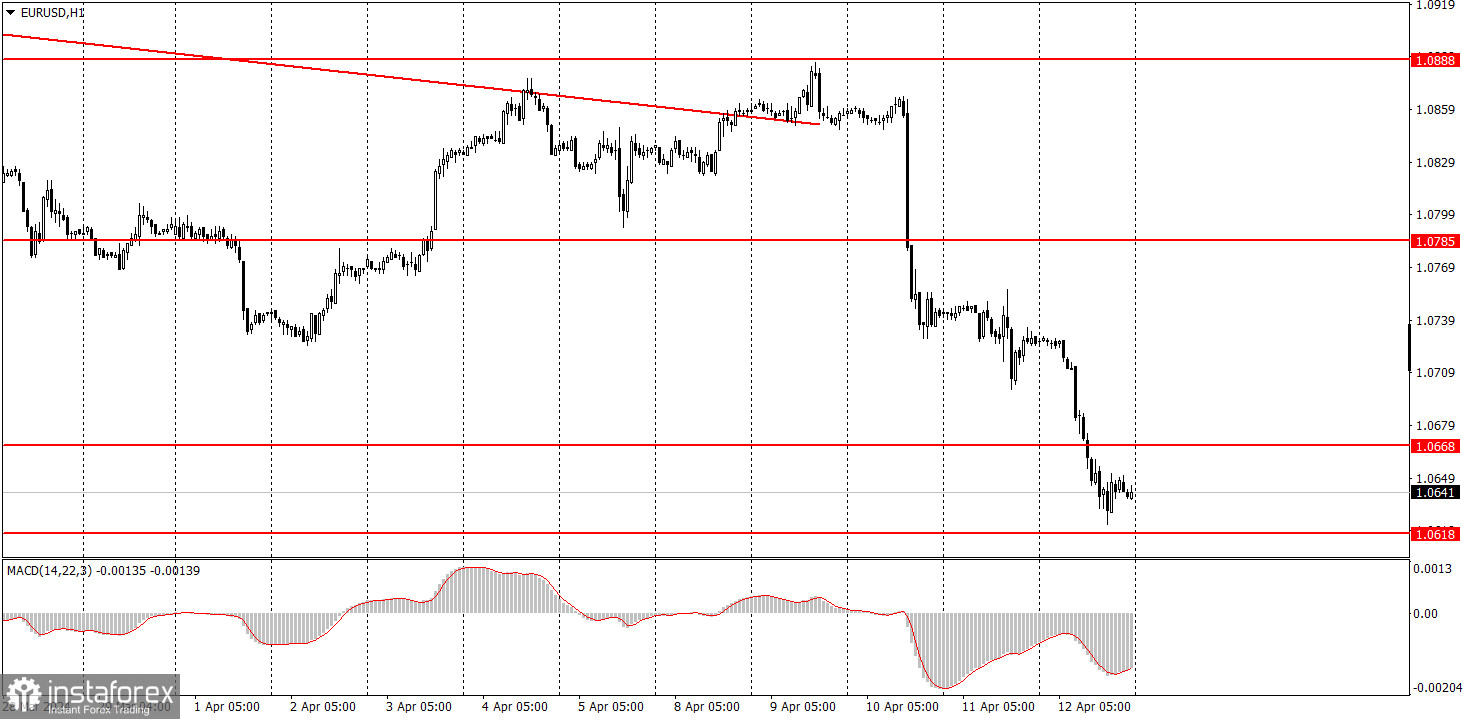
EUR/USD resumed its sharp downward movement on Friday, although this time there were no macroeconomic reasons behind it. The euro started to fall on Wednesday after the US inflation report was released. The Consumer Price Index accelerated to 3.5%, putting an end to the market's expectations of a Federal Reserve rate cut in June. The dollar has significantly appreciated based on the US central bank's hawkish stance. However, we want to remind you that this isn't the only factor that has been helping the dollar. In general, the fundamental backdrop has long suggested that only the US currency should rise. Therefore, we weren't surprised that the dollar rose on Friday. We believe that the pair should fall further, at least towards the 1.02-1.04 area.
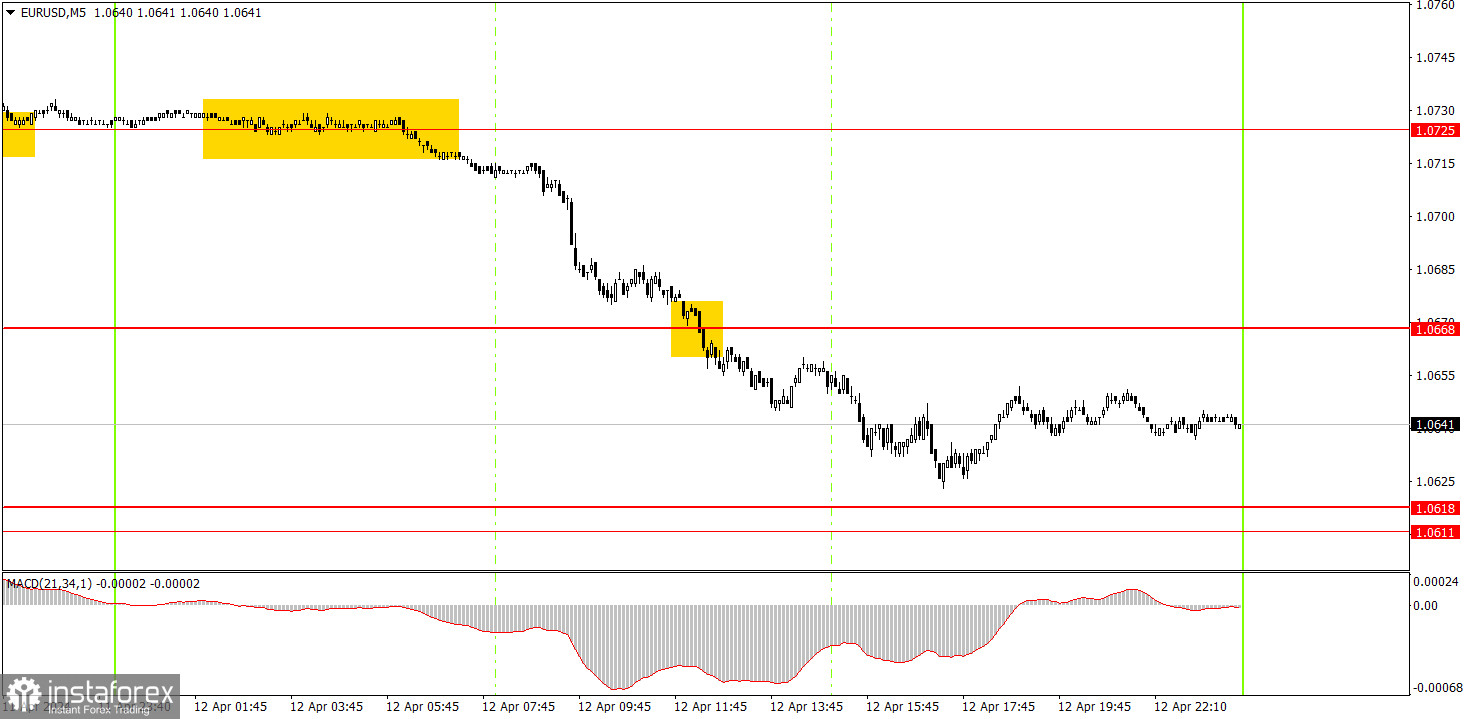
Two trading signals were generated on the 5-minute timeframe. Since the price moved predominantly in one direction for most of the day, it was possible to make a very good profit on this movement. During the Asian trading session, the price settled below the 1.0725 level, so traders could enter short positions at the opening of the European session. Then, the price breached the 1.0668 level, and the pair remained below this level for the rest of the day. Therefore, short positions could be closed at any point closer to the evening. The profit from the only trade of the day was around 75 pips.
On the hourly chart, the downtrend persists. We believe that the euro should continue to fall regardless, as it is still too high, and the global trend is downward. Both this week's and last week's macro data provide full support for the US dollar. The fundamental background indicates that the ECB will start lowering rates at the next meeting, while the Fed's move remains uncertain.
On Monday, the pair will likely start a corrective move as the pair has fallen by a total of 230 pips in the last three days. At the same time, we have seen promising sell signals lately.
The key levels on the 5M chart are 1.0568, 1.0611-1.0618, 1.0668, 1.0725, 1.0785-1.0797, 1.0838-1.0856, 1.0888-1.0896, 1.0940, 1.0971-1.0981, 1.1011, 1.1043, 1.1091. The euro area industrial production report and the US retail sales data will be published on Monday. Both reports are not crucial, so the market may show a minor reaction.
1) Signal strength is determined by the time taken for its formation (either a bounce or level breach). A shorter formation time indicates a stronger signal.
2) If two or more trades around a certain level are initiated based on false signals, subsequent signals from that level should be disregarded.
3) In a flat market, any currency pair can produce multiple false signals or none at all. In any case, the flat trend is not the best condition for trading.
4) Trading activities are confined between the onset of the European session and mid-way through the U.S. session, after which all open trades should be manually closed.
5) On the 30-minute timeframe, trades based on MACD signals are only advisable amidst substantial volatility and an established trend, confirmed either by a trendline or trend channel.
6) If two levels lie closely together (ranging from 5 to 15 pips apart), they should be considered as a support or resistance zone.
Support and Resistance price levels can serve as targets when buying or selling. You can place Take Profit levels near them.
Red lines represent channels or trend lines, depicting the current market trend and indicating the preferable trading direction.
The MACD(14,22,3) indicator, encompassing both the histogram and signal line, acts as an auxiliary tool and can also be used as a signal source.
Significant speeches and reports (always noted in the news calendar) can profoundly influence the price dynamics. Hence, trading during their release calls for heightened caution. It may be reasonable to exit the market to prevent abrupt price reversals against the prevailing trend.
Beginning traders should always remember that not every trade will yield profit. Establishing a clear strategy coupled with sound money management is the cornerstone of sustained trading success.
*La presente analisi del mercato ha un carattere esclusivamente informativo e non rappresenta una guida per l`effettuazione di una transazione.
Le recensioni analitiche di InstaSpot ti renderanno pienamente consapevole delle tendenze del mercato! Essendo un cliente InstaSpot, ti viene fornito un gran numero di servizi gratuiti per il trading efficiente.


