


Nella nostra squadra ci sono più di 7.000.000 trader! Ogni giorno ci impegniamo a far sì che il trading migliori. Conseguiamo grandi risultati e ci muoviamo in avanti.
Il riconoscimento da parte di milioni di trader in tutto il mondo rappresenta l'alta valutazione della nostra attività! Voi avete fatto la vostra scelta e noi faremo la nostra al fine di soddisfare le vostre aspettative!
Assieme siamo una grande squadra!
InstaSpot. Siamo orgogliosi di lavorare per voi!


Attore, campione del mondo di lotta libera e semplicemente un vero maciste russo! Persona venuta dal nulla. Persona che rispecchia i nostri obiettivi. Il segreto del successo di Taktarov consiste nel mirare continuamente al suo scopo.
Dischiudi anche tu tutti gli aspetti del tuo talento! Impara, prova, sbaglia, ma non fermarti!
InstaSpot - la storia delle tue vittorie inizia qui!

Yesterday, EUR/USD returned to its preferred style of movement in recent months. And of course, the holiday didn't last long. For the first time in a long while, we saw a truly strong and trending movement on Wednesday, but it seems that the market's enthusiasm quickly faded. Now on Thursday, despite the European Central Bank meeting and ECB President Christine Lagarde's speech, volatility was low again, and there were no notable changes. To be fair, the ECB did not make any significant decisions, and we only received hints about a possible rate cut in June. However, that's not the main point. The main point is that it is almost guaranteed that the Federal Reserve will not lower rates in June. And this means that contrary to market expectations, the ECB will be the first one to start the rate cut cycle. This is a bearish factor for the euro, so we still expect the pair to fall further.
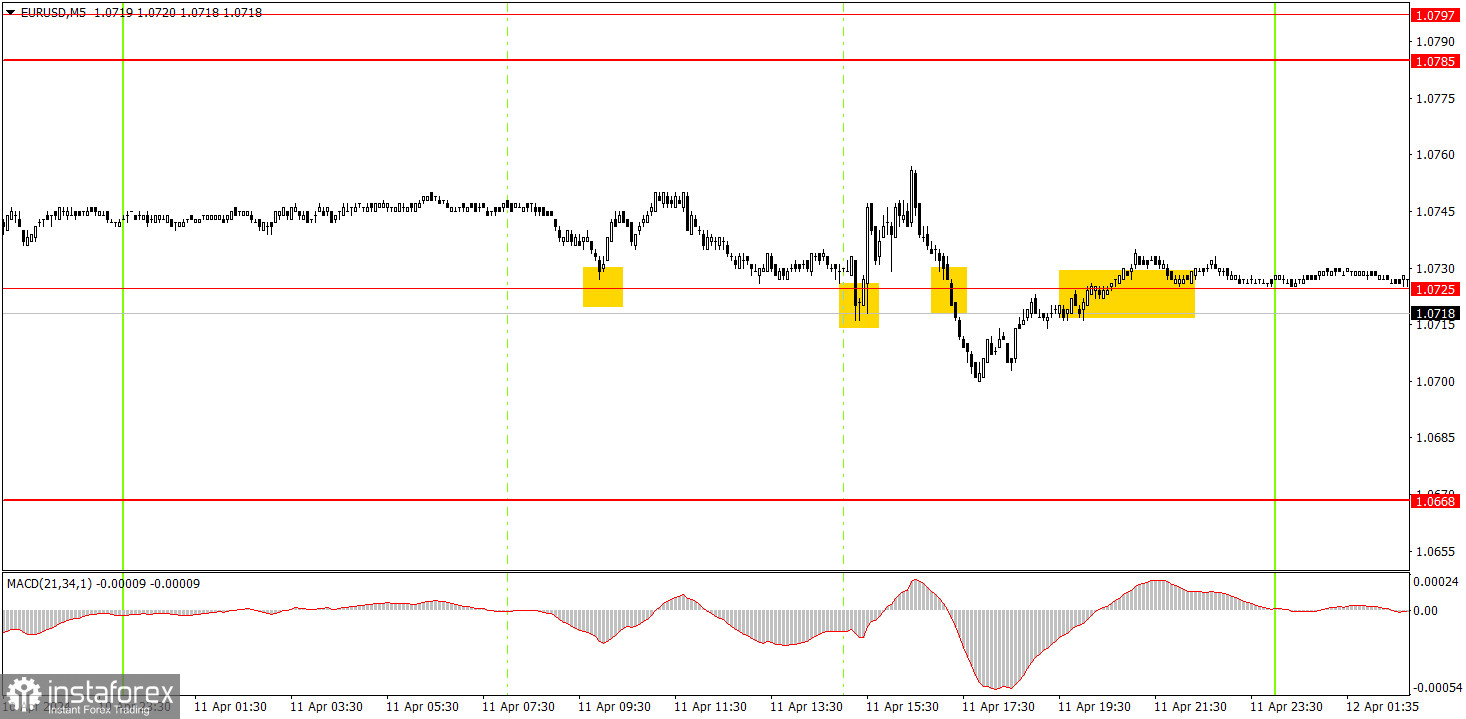
Several trading signals were generated on the 5-minute timeframe, and they were all around the level of 1.0725. All of them were false signals, as the price could not reach the target level due to low volatility. Therefore, beginners could have executed the first two buy signals. In both cases, the pair moved in the right direction by more than 15 pips, so a stop-loss to breakeven should have been set for both trades. Both trades closed at breakeven. It was not advisable to execute the last two signals.
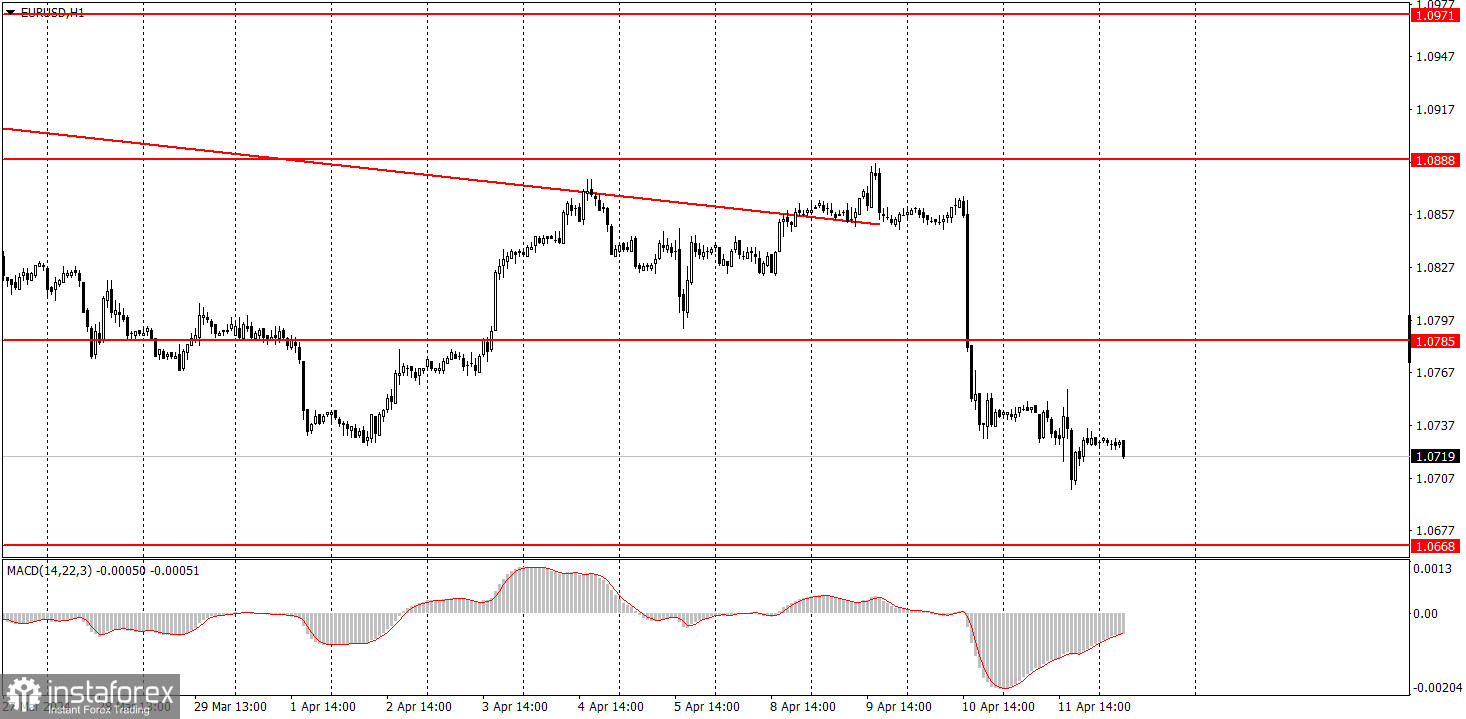
On the hourly chart, the downtrend persists. We believe that the euro should continue to fall regardless, as the currency is still too high, and the global trend is downward. Both this week's and last week's macro data provide full support for the US dollar. The fundamental background indicates that the ECB will start lowering rates at the next meeting, while the Fed's move remains uncertain.
Today, the pair will likely go through some correction, but we still expect the quotes to fall further. Therefore, we are looking for sell signals, but we should not expect a strong downward movement again.
The key levels on the 5M chart are 1.0568, 1.0611-1.0618, 1.0668, 1.0725, 1.0785-1.0797, 1.0838-1.0856, 1.0888-1.0896, 1.0940, 1.0971-1.0981, 1.1011, 1.1043, 1.1091. Today, German inflation figures for March wrap up the week on the euro area economic calendar. In the US, the University of Michigan Consumer Sentiment Index will be published. Both reports are not crucial, so we don't expect a strong market reaction.
1) Signal strength is determined by the time taken for its formation (either a bounce or level breach). A shorter formation time indicates a stronger signal.
2) If two or more trades around a certain level are initiated based on false signals, subsequent signals from that level should be disregarded.
3) In a flat market, any currency pair can produce multiple false signals or none at all. In any case, the flat trend is not the best condition for trading.
4) Trading activities are confined between the onset of the European session and mid-way through the U.S. session, after which all open trades should be manually closed.
5) On the 30-minute timeframe, trades based on MACD signals are only advisable amidst substantial volatility and an established trend, confirmed either by a trendline or trend channel.
6) If two levels lie closely together (ranging from 5 to 15 pips apart), they should be considered as a support or resistance zone.
Support and Resistance price levels can serve as targets when buying or selling. You can place Take Profit levels near them.
Red lines represent channels or trend lines, depicting the current market trend and indicating the preferable trading direction.
The MACD(14,22,3) indicator, encompassing both the histogram and signal line, acts as an auxiliary tool and can also be used as a signal source.
Significant speeches and reports (always noted in the news calendar) can profoundly influence the price dynamics. Hence, trading during their release calls for heightened caution. It may be reasonable to exit the market to prevent abrupt price reversals against the prevailing trend.
Beginning traders should always remember that not every trade will yield profit. Establishing a clear strategy coupled with sound money management is the cornerstone of sustained trading success.
*La presente analisi del mercato ha un carattere esclusivamente informativo e non rappresenta una guida per l`effettuazione di una transazione.
Le recensioni analitiche di InstaSpot ti renderanno pienamente consapevole delle tendenze del mercato! Essendo un cliente InstaSpot, ti viene fornito un gran numero di servizi gratuiti per il trading efficiente.


