


La leggenda nel team InstaSpot!!
Legenda! Pensi che sia troppo patetico? Ma come dobbiamo chiamare un uomo, che è diventato il primo dell'Asia a vincere il campionato mondiale di scacchi a 18 anni e che è diventato il primo Gran Maestro indiano a 19? Fu l'inizio di un duro cammino verso il titolo di campione del mondo, l'uomo che divenne per sempre una parte della storia di scacchi. Un'altra leggenda nel team InstaSpot!


Il Borussia è una delle squadre di calcio più titolate in Germania, che ha ripetutamente dimostrato ai tifosi che lo spirito di competizione e leadership porta al successo. Fai trading nello stesso modo in cui lo fanno i professionisti dello sport - fiduciosamente e attivamente. Segui il Borussia FC e sii avanti con InstaSpot!

EUR/USD traded higher on Thursday, marking the third consecutive day of gains. The macroeconomic and fundamental backdrop favored the US dollar throughout Tuesday, Wednesday, and Thursday. This included reports such as ADP and JOLTS in the US and the euro area inflation report. While there were some data points working against the dollar, they were just a few in number. However, for some reason, the market ignored all the reports that should have supported the dollar.
The same applies to fundamental events. Federal Reserve Chief Jerome Powell showed a hawkish stance once again, while the European Central Bank minutes leaned dovish. Powell reiterated that the Fed would not rush to lower the key rate, as he was unsure if inflation would reach the target level. The ECB minutes indicated that inflation was declining at a good pace, providing more grounds for a rate cut. Therefore, we consider the movement of the past three days to be entirely logical. Initially, it looked like a technical correction, but now the correction is taking such a long time. And if the latest US NonFarm Payrolls and unemployment reports turn out to be even slightly weaker than expected, the euro will surge.
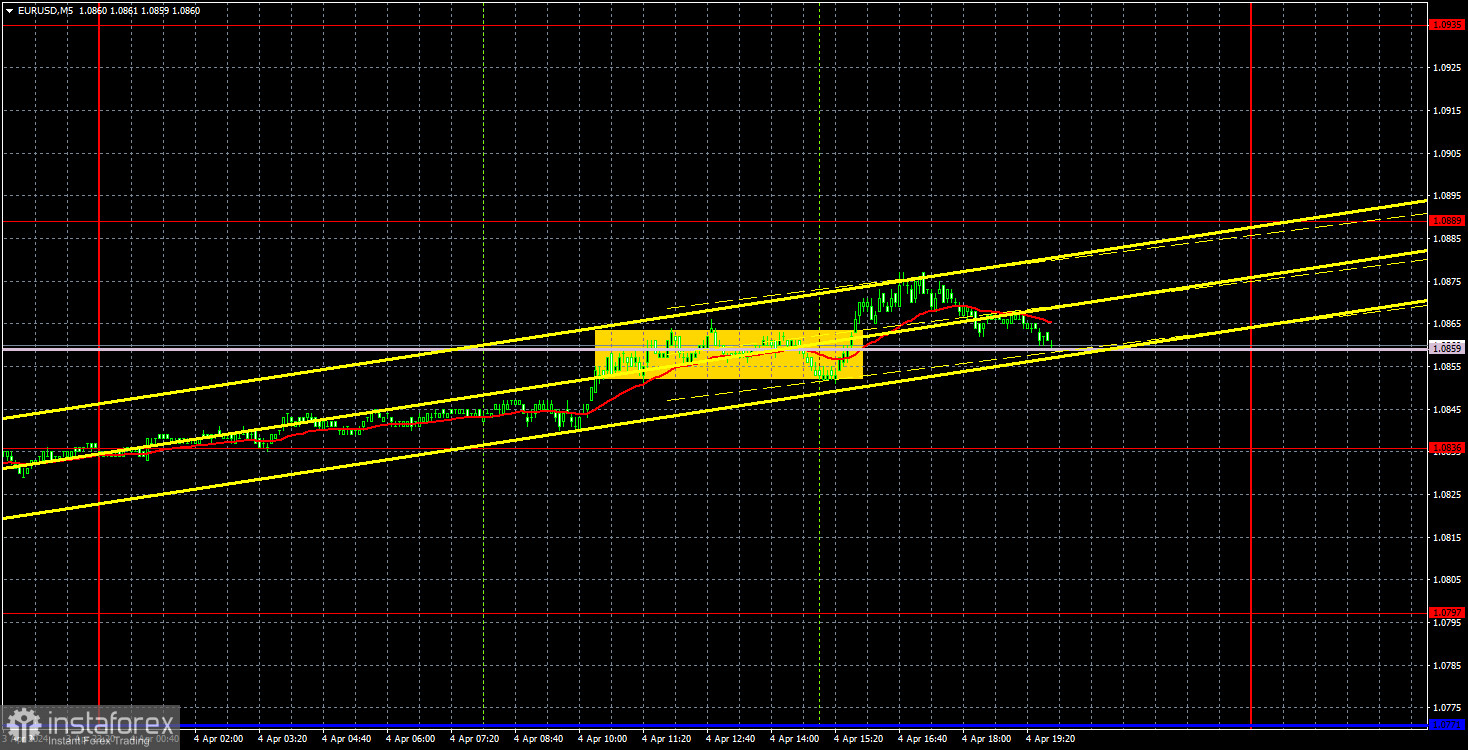
Despite the euro's three-day rally, volatility was just decent on Monday and Wednesday. Yesterday, it did not exceed 45 pips, which is quite low for the euro. Only one trading signal formed on Thursday, but it did not yield any profit as the pair is gradually rising, and the signal did not form at the beginning of the movement. Therefore, traders could have traded the breakout of the Senkou Span B line; however, there could be no loss on this long position since the price did not fall below this line.
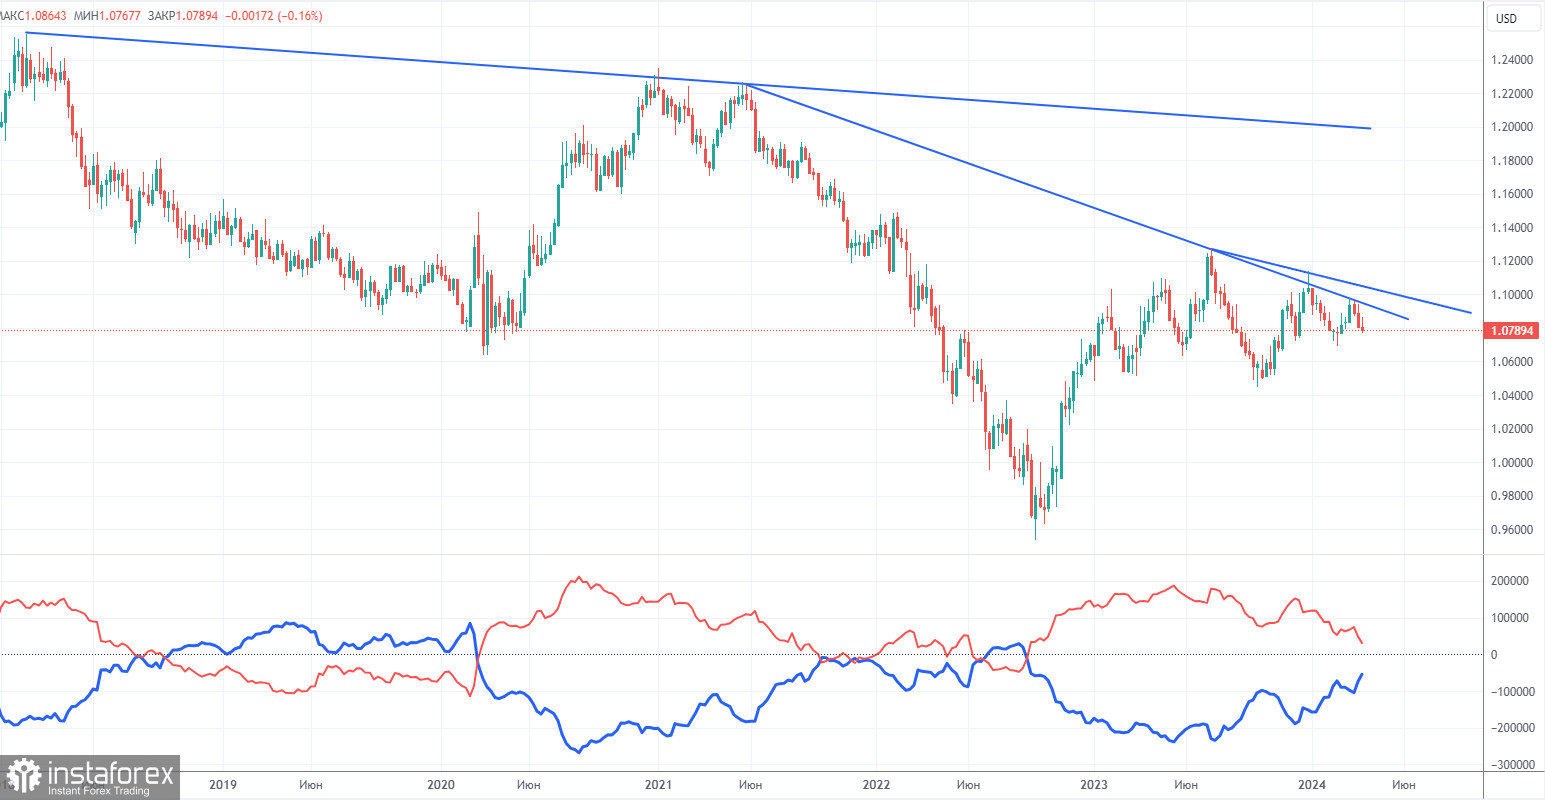
The latest COT report is dated March 26. The net position of non-commercial traders has been bullish for quite some time. Basically, the number of long positions in the market is higher than the number of short positions. However, at the same time, the net position of non-commercial traders (red line) has been decreasing in recent months, while that of commercial traders (blue line) has been increasing. This shows that market sentiment is turning bearish, as speculators increasingly sell the euro. Furthermore, we don't see any fundamental factors that can support the euro's strength, while technical analysis also suggests a downtrend. Three descending trend lines on the weekly chart indicate that there's a good chance of extending the decline.
At present, the red and blue lines are moving towards each other (indicating a trend reversal after a rise). Therefore, we believe that the euro will fall further. During the last reporting week, the number of long positions for the non-commercial group decreased by 2,200, while the number of short positions increased by 15,000. Accordingly, the net position decreased by 17,200. The number of buy contracts is higher than the number of sell contracts among non-commercial traders by only 31,000 (previously 48,000).
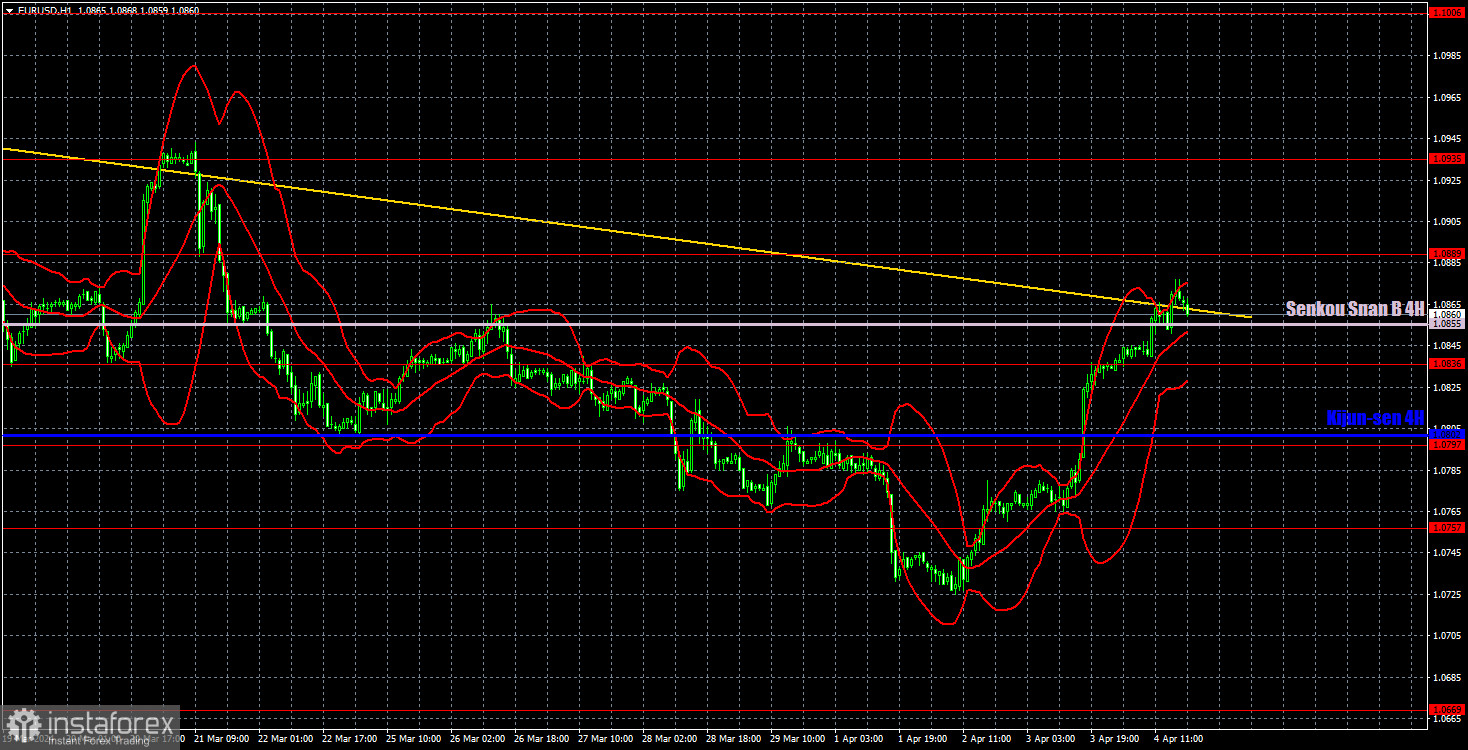
On the 1-hour chart, the downtrend persists even if the price broke through the trend line, which could also be a false signal. EUR/USD is currently correcting higher, but the descending trendline continues to support sellers. The dollar should still rise in almost any case, as the overall fundamental background is on its side. The macroeconomic background also supports it, but this week the market has ignored most of the reports instead of responding to them. Today, everything will depend on the US labor market data.
On April 5, we highlight the following levels for trading: 1.0530, 1.0581, 1.0658-1.0669, 1.0757, 1.0797, 1.0836, 1.0889, 1.0935, 1.1006, 1.1092, as well as the Senkou Span B line (1.0855) and the Kijun-sen line (1.0802. The Ichimoku indicator lines can move during the day, so this should be taken into account when identifying trading signals. Don't forget to set a Stop Loss to breakeven if the price has moved in the intended direction by 15 pips. This will protect you against potential losses if the signal turns out to be false.
On Friday, the eurozone will publish the less important retail sales report, while the US will release crucial reports on unemployment and Nonfarm Payrolls. We expect strong movements in the second half of the day.
Support and resistance levels are thick red lines near which the trend may end. They do not provide trading signals;
The Kijun-sen and Senkou Span B lines are the lines of the Ichimoku indicator, plotted to the 1H timeframe from the 4H one. They provide trading signals;
Extreme levels are thin red lines from which the price bounced earlier. They provide trading signals;
Yellow lines are trend lines, trend channels, and any other technical patterns;
Indicator 1 on the COT charts is the net position size for each category of traders;
*La presente analisi del mercato ha un carattere esclusivamente informativo e non rappresenta una guida per l`effettuazione di una transazione.
Le recensioni analitiche di InstaSpot ti renderanno pienamente consapevole delle tendenze del mercato! Essendo un cliente InstaSpot, ti viene fornito un gran numero di servizi gratuiti per il trading efficiente.


