


La leggenda nel team InstaSpot!!
Legenda! Pensi che sia troppo patetico? Ma come dobbiamo chiamare un uomo, che è diventato il primo dell'Asia a vincere il campionato mondiale di scacchi a 18 anni e che è diventato il primo Gran Maestro indiano a 19? Fu l'inizio di un duro cammino verso il titolo di campione del mondo, l'uomo che divenne per sempre una parte della storia di scacchi. Un'altra leggenda nel team InstaSpot!


Il Borussia è una delle squadre di calcio più titolate in Germania, che ha ripetutamente dimostrato ai tifosi che lo spirito di competizione e leadership porta al successo. Fai trading nello stesso modo in cui lo fanno i professionisti dello sport - fiduciosamente e attivamente. Segui il Borussia FC e sii avanti con InstaSpot!

GBP/USD also showed positive trades on Wednesday. As we mentioned in the EUR/USD article, there were no fundamental or macroeconomic reasons for such movement. The US ISM Services PMI turned out to be lower than forecasts, but it wasn't bad enough to cause such a sharp decline in the dollar. The ADP report, which exceeded expectations, was ignored by the market. Federal Reserve Chair Jerome Powell's speech started after the dollar had already fallen by 80 pips, so it did not particularly exert pressure.
The whole point is that the price approached the level of 1.2500, which has been the lower boundary of the sideways channel for 4 months now. Naturally, the market did not want to form a downward trend because it refuses to buy the dollar. Perhaps it's all due to covert interventions by the Bank of England, because frankly speaking, such behavior is quite surprising. Anything can fall, but not the pound. Nevertheless, the sideways movement persists, and now the price can go up to the 28th level, where the upper boundary of the sideways channel lies on the 24-hour chart.
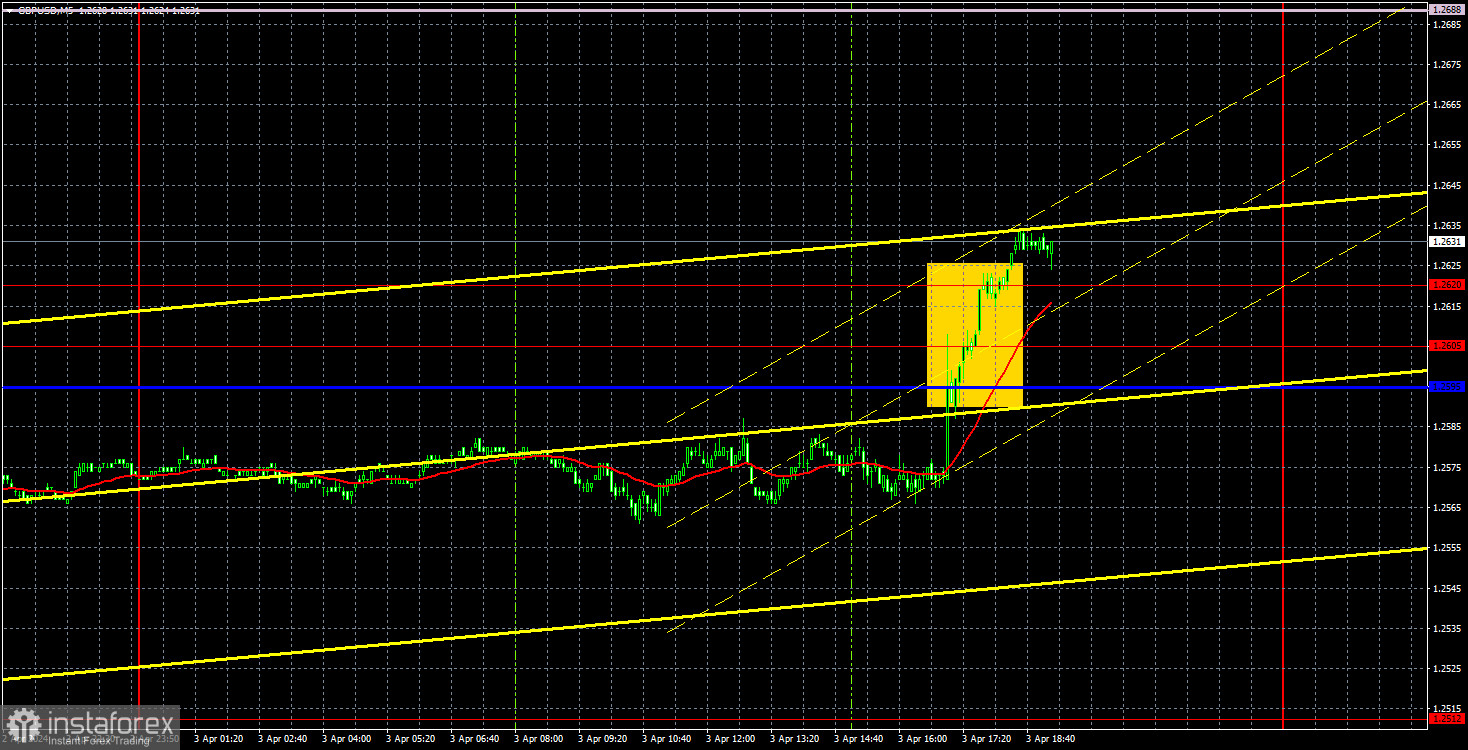
There was one trading signal on Wednesday, and it was quite inadequate. However, this is not surprising since the pair continues to move sideways on the 24-hour timeframe. And in such cases, we receive a lot of bad signals because the Ichimoku indicator lines are very close to each other. Yesterday, the pair crossed the Kijun-sen line and immediately found itself near the area of 1.2605-1.2620, which should have been surpassed before opening a long position. In the end, the signal was formed, but it didn't yield much profit - only about 15 pips. On the other hand, traders can still hold on to longs, as the price clearly rebounded from the lower boundary of the sideways channel and now it seems like it is preparing for another round of growth.
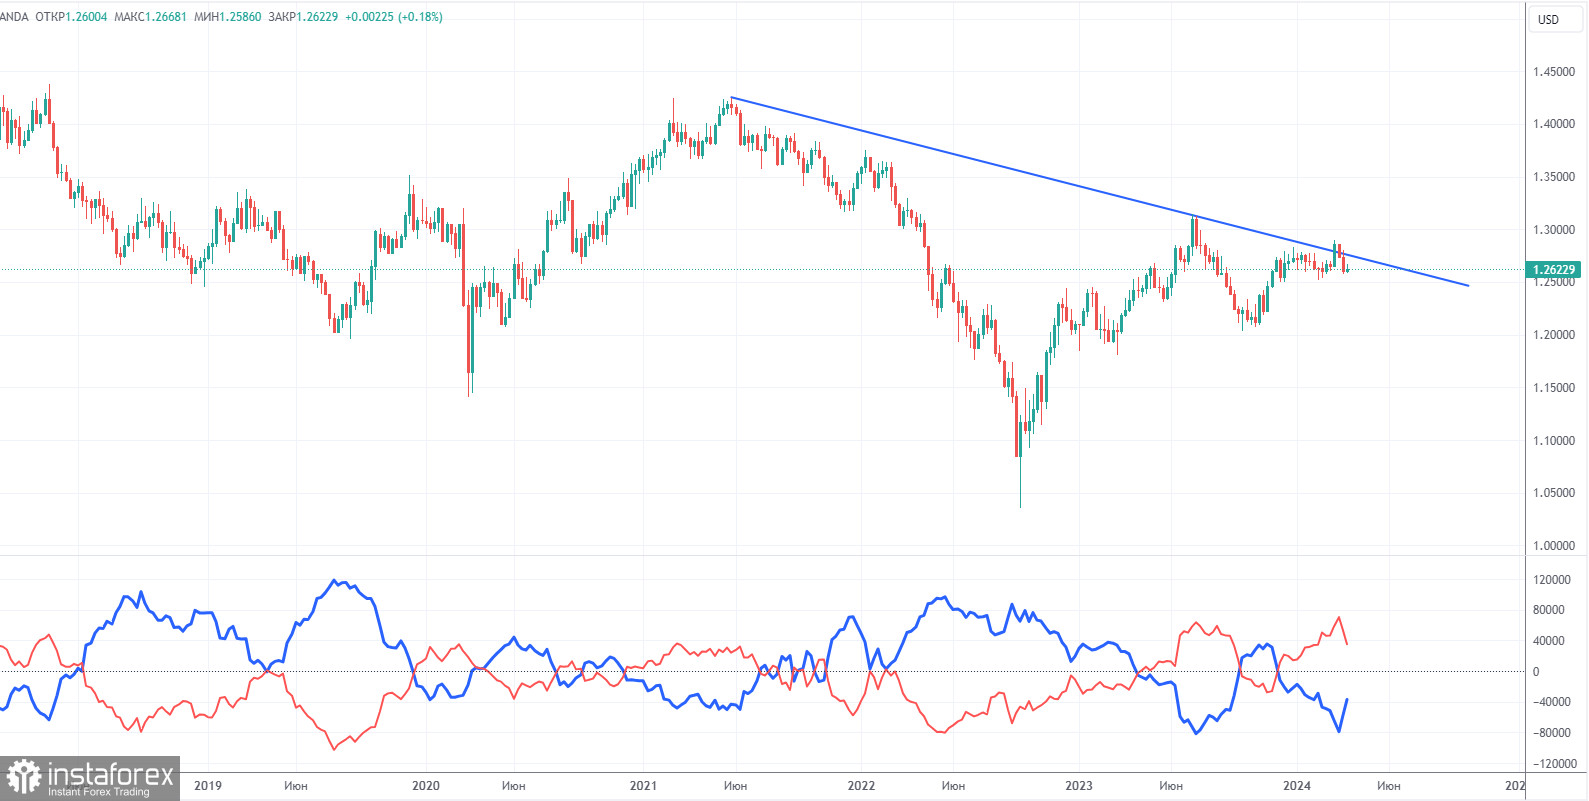
COT reports on the British pound show that the sentiment of commercial traders has frequently changed in recent months. The red and blue lines, which represent the net positions of commercial and non-commercial traders, constantly intersect and, in most cases, remain close to the zero mark. According to the latest report on the British pound, the non-commercial group closed 11,300 buy contracts and opened 6,700 short ones. As a result, the net position of non-commercial traders decreased by 18,000 contracts in a week. It is quite interesting that even such changes do not lead to a significant decline in the pound. The fundamental background still does not provide a basis for long-term purchases of the pound sterling.
The non-commercial group currently has a total of 91,300 buy contracts and 56,100 sell contracts. The bulls no longer have a significant advantage. And yet, the pound refuses to fall, but such irony cannot persist. The technical analysis also suggests that the pound should fall further (descending trend line), but we still have a total flat on the 24-hour timeframe.
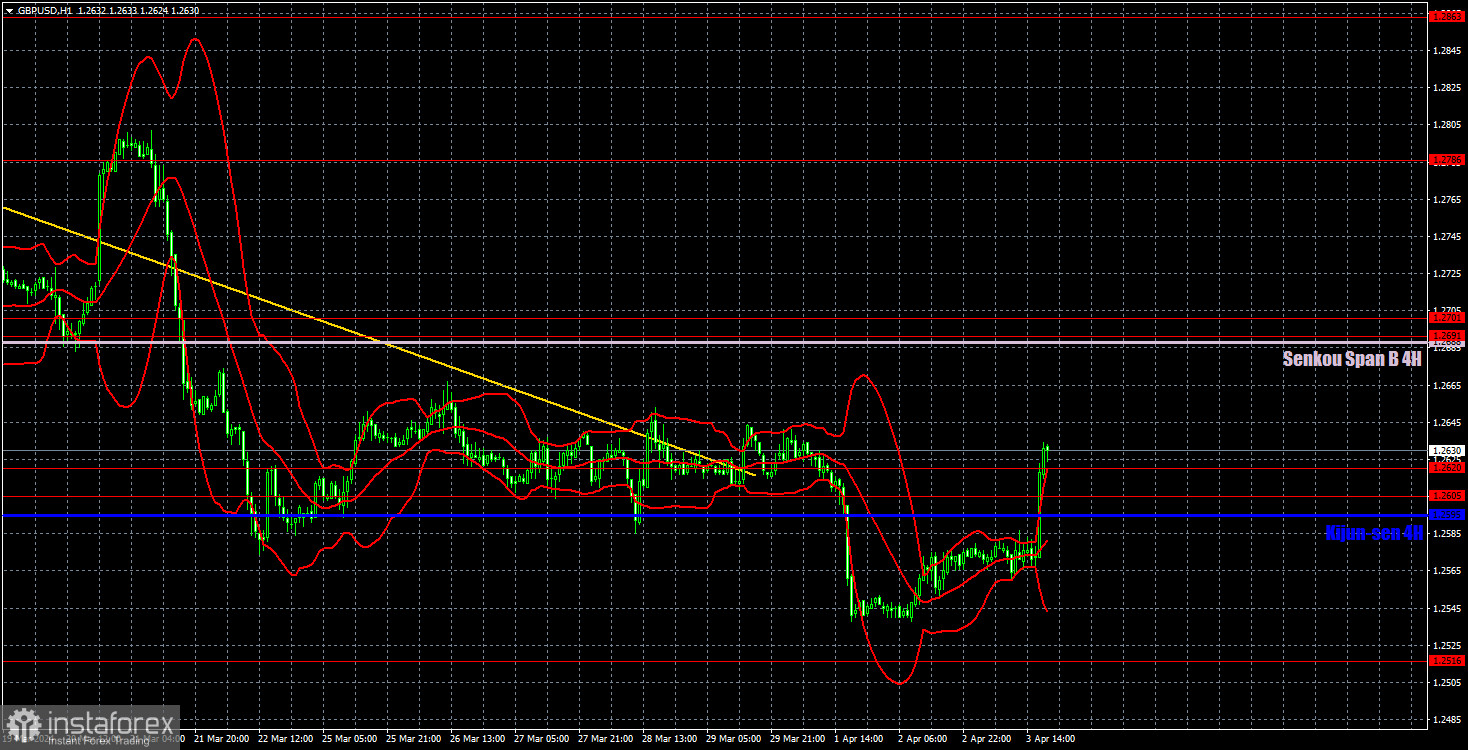
On the 1H chart, GBP/USD has started a new upward movement within the flat phase on the 24-hour timeframe. We still expect the pound to fall further, however, as long as the flat persists, the pair will either rise or fall, unrelated to news and reports. This week, the fundamentals and macroeconomics have largely favored the dollar, but once again, the pound traded higher.
As of April 4, we highlight the following important levels: 1.2215, 1.2269, 1.2349, 1.2429-1.2445, 1.2516, 1.2605-1.2620, 1.2691-1.2701, 1.2786, 1.2863, 1.2981-1.2987. The Senkou Span B line (1.2688) and the Kijun-sen line (1.2595) can also serve as sources of signals. Don't forget to set a Stop Loss to breakeven if the price has moved in the intended direction by 20 pips. The Ichimoku indicator lines may move during the day, so this should be taken into account when determining trading signals.
On Thursday, the UK will publish the final assessment of the Services PMI report for March. This report has very little chance of influencing the pair's movement, which is not required by the market at the moment. The US will release a secondary report on jobless claims.
Support and resistance levels are thick red lines near which the trend may end. They do not provide trading signals;
The Kijun-sen and Senkou Span B lines are the lines of the Ichimoku indicator, plotted to the 1H timeframe from the 4H one. They provide trading signals;
Extreme levels are thin red lines from which the price bounced earlier. They provide trading signals;
Yellow lines are trend lines, trend channels, and any other technical patterns;
Indicator 1 on the COT charts is the net position size for each category of traders;
*La presente analisi del mercato ha un carattere esclusivamente informativo e non rappresenta una guida per l`effettuazione di una transazione.
Le recensioni analitiche di InstaSpot ti renderanno pienamente consapevole delle tendenze del mercato! Essendo un cliente InstaSpot, ti viene fornito un gran numero di servizi gratuiti per il trading efficiente.


