


Nella nostra squadra ci sono più di 7.000.000 trader! Ogni giorno ci impegniamo a far sì che il trading migliori. Conseguiamo grandi risultati e ci muoviamo in avanti.
Il riconoscimento da parte di milioni di trader in tutto il mondo rappresenta l'alta valutazione della nostra attività! Voi avete fatto la vostra scelta e noi faremo la nostra al fine di soddisfare le vostre aspettative!
Assieme siamo una grande squadra!
InstaSpot. Siamo orgogliosi di lavorare per voi!


Attore, campione del mondo di lotta libera e semplicemente un vero maciste russo! Persona venuta dal nulla. Persona che rispecchia i nostri obiettivi. Il segreto del successo di Taktarov consiste nel mirare continuamente al suo scopo.
Dischiudi anche tu tutti gli aspetti del tuo talento! Impara, prova, sbaglia, ma non fermarti!
InstaSpot - la storia delle tue vittorie inizia qui!

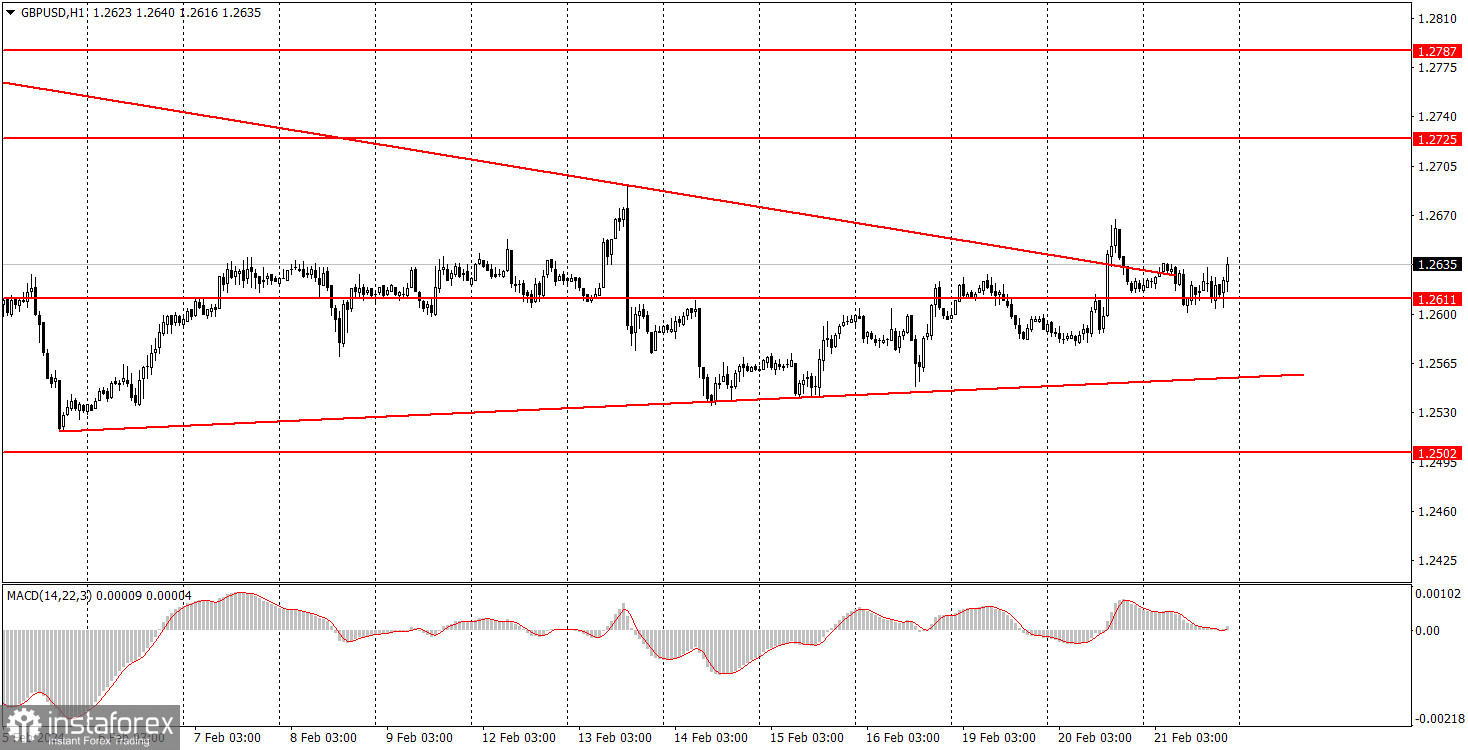
GBP/USD traded with low volatility, and there were basically no movements. A day earlier, the market somehow reacted to Bank of England Andrew Bailey's speech. On Wednesday, there was nothing to react to and the market went into hibernation again. Formally, we currently have an upward trend, which is shown by the corresponding trend line. However, in reality it is not a trend. We're clearly seeing a flat on the higher timeframes, and confusing movements or short-term trends on the lower timeframes, which doesn't help in opening deals.
The British pound is still overbought, and the market simply refuses to trade it on every timeframe. Even the hourly chart shows that the price is moving more sideways than up or down.
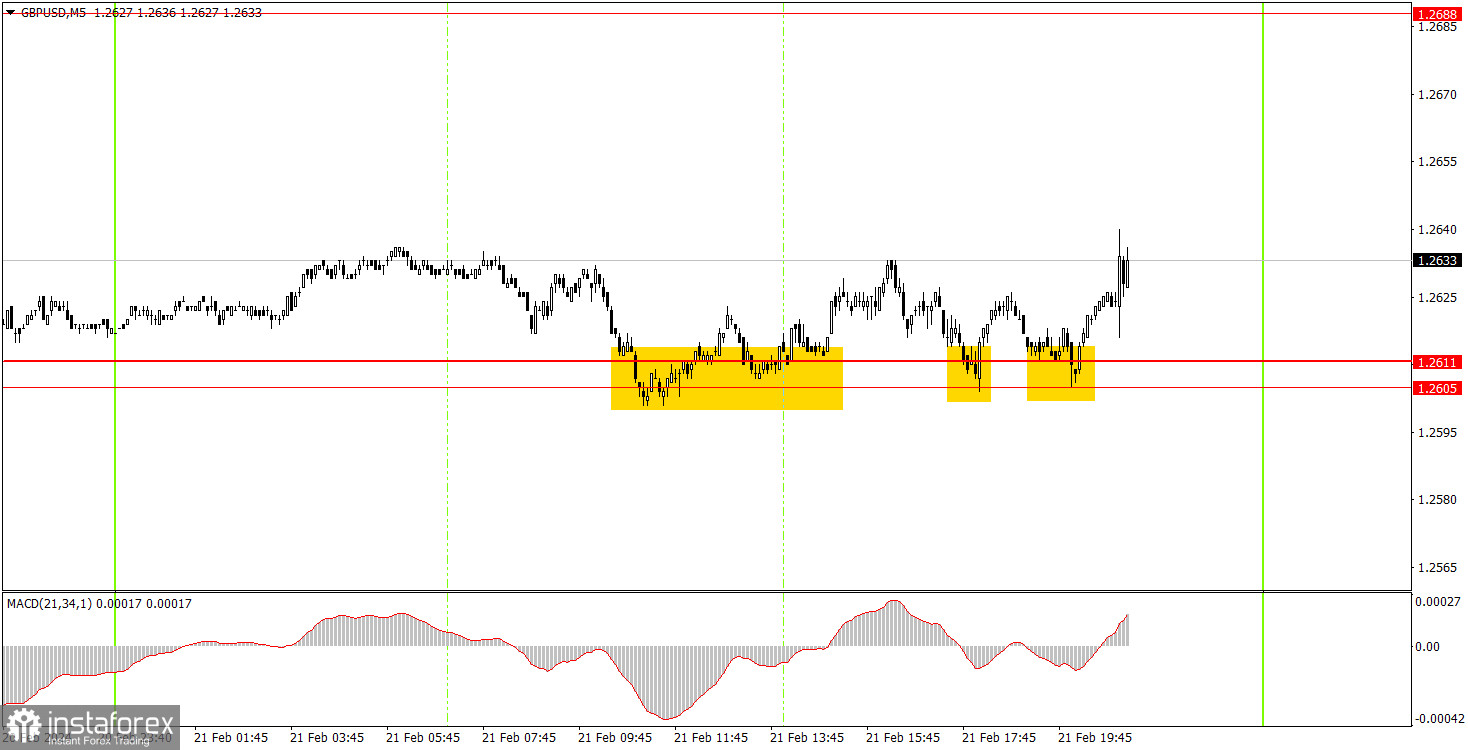
GBP/USD formed three rebounds from the area of 1.2605-1.2611 on the 5-minute timeframe. Traders could open a long position in any of these three cases. Therefore, they could only gain profit if they manually closed the long position at the maximum value of the price, which they had to simply guess. However, they wouldn't lose anything for any of the transactions, as the price could not settle below the area of 1.2605-1.2611.
On the hourly chart, GBP/USD left the sideways channel of 1.2611-1.2787 and is desperately trying to start a downtrend. However, it is not going well. Currently, there is an ascending trendline on the hourly timeframe, which was descending on Tuesday, and there is no clear trend at the moment. In the medium-term, we only expect declines for the pound, but the market continues to trade the pair in the most chaotic and illogical manner.
The key levels on the 5M chart are 1.2270, 1.2310, 1.2372-1.2387, 1.2457, 1.2502, 1.2544, 1.2605-1.2611, 1.2688, 1.2725, 1.2787-1.2791, 1.2848-1.2860, 1.2913, 1.2981-1.2993. On Thursday, investors will look to the release of the manufacturing and services PMI prints from the UK, and the US. Basically, these are the key reports for the week because there's nothing else. The US will release a report on initial jobless claims, which has the same degree of importance as business activity indices.
1) Signal strength is determined by the time taken for its formation (either a bounce or level breach). A shorter formation time indicates a stronger signal.
2) If two or more trades around a certain level are initiated based on false signals, subsequent signals from that level should be disregarded.
3) In a flat market, any currency pair can produce multiple false signals or none at all. In any case, the flat trend is not the best condition for trading.
4) Trading activities are confined between the onset of the European session and mid-way through the U.S. session, after which all open trades should be manually closed.
5) On the 30-minute timeframe, trades based on MACD signals are only advisable amidst substantial volatility and an established trend, confirmed either by a trendline or trend channel.
6) If two levels lie closely together (ranging from 5 to 15 pips apart), they should be considered as a support or resistance zone.
Support and Resistance price levels can serve as targets when buying or selling. You can place Take Profit levels near them.
Red lines represent channels or trend lines, depicting the current market trend and indicating the preferable trading direction.
The MACD(14,22,3) indicator, encompassing both the histogram and signal line, acts as an auxiliary tool and can also be used as a signal source.
Significant speeches and reports (always noted in the news calendar) can profoundly influence the price dynamics. Hence, trading during their release calls for heightened caution. It may be reasonable to exit the market to prevent abrupt price reversals against the prevailing trend.
Beginners should always remember that not every trade will yield profit. Establishing a clear strategy coupled with sound money management is the cornerstone of sustained trading success.
*La presente analisi del mercato ha un carattere esclusivamente informativo e non rappresenta una guida per l`effettuazione di una transazione.
Le recensioni analitiche di InstaSpot ti renderanno pienamente consapevole delle tendenze del mercato! Essendo un cliente InstaSpot, ti viene fornito un gran numero di servizi gratuiti per il trading efficiente.


