


Nella nostra squadra ci sono più di 7.000.000 trader! Ogni giorno ci impegniamo a far sì che il trading migliori. Conseguiamo grandi risultati e ci muoviamo in avanti.
Il riconoscimento da parte di milioni di trader in tutto il mondo rappresenta l'alta valutazione della nostra attività! Voi avete fatto la vostra scelta e noi faremo la nostra al fine di soddisfare le vostre aspettative!
Assieme siamo una grande squadra!
InstaSpot. Siamo orgogliosi di lavorare per voi!


Attore, campione del mondo di lotta libera e semplicemente un vero maciste russo! Persona venuta dal nulla. Persona che rispecchia i nostri obiettivi. Il segreto del successo di Taktarov consiste nel mirare continuamente al suo scopo.
Dischiudi anche tu tutti gli aspetti del tuo talento! Impara, prova, sbaglia, ma non fermarti!
InstaSpot - la storia delle tue vittorie inizia qui!

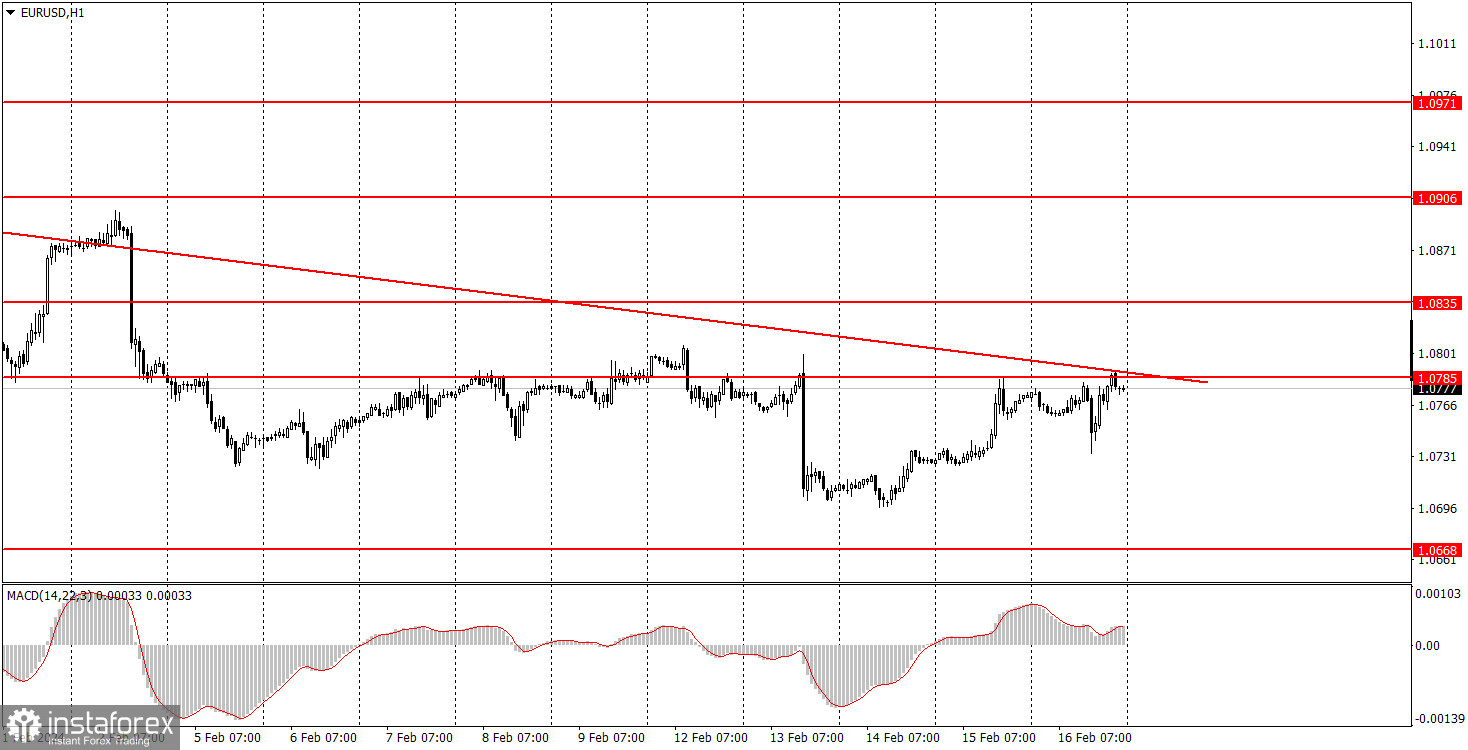
EUR/USD continued to fluctuate on Friday. The price tried to move away from the level of 1.0785, but in the second half of the day, it returned to this mark, and also tested the trendline. Therefore, the current downtrend is on the verge of being canceled. If the pair consolidates above the trendline on Monday or Tuesday, then the euro may strengthen. However, we don't expect the pair to show firm growth, as there are no fundamental and macroeconomic reasons for it.
On Friday, there were no interesting events in the European Union. The U.S. released two reports that traders reacted to. First, the Producer Price Index, unexpectedly exceeding forecasts, which triggered a dollar rally. However, an hour later, the University of Michigan Consumer Sentiment Index was released, which was below expectations and put pressure on the dollar. These two reports explain the pair's movements on Friday.
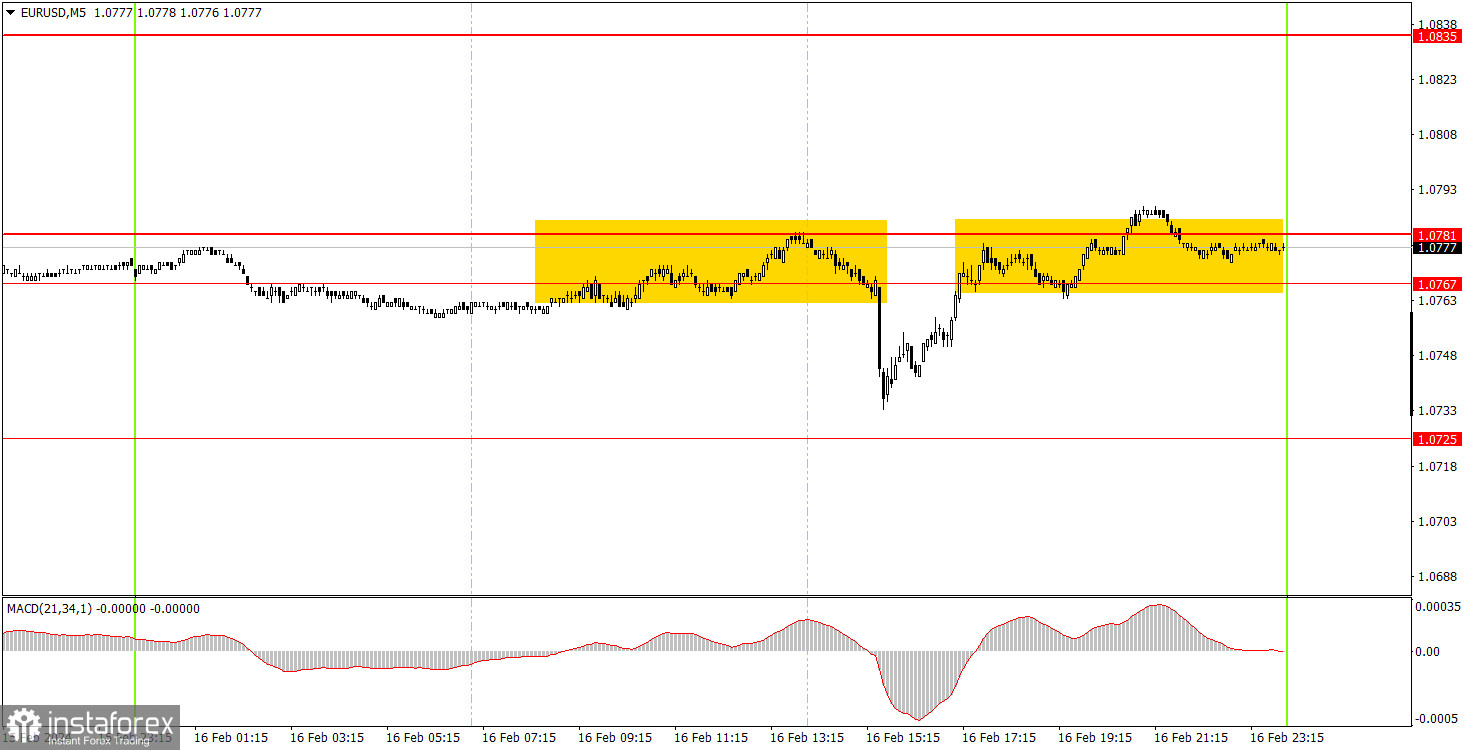
Only one trading signal was generated on the 5-minute timeframe. At the beginning of the US session, the price bounced off the range of 1.0767-1.0781, after which it managed to fall by about 25 pips. However, the first U.S. report triggered this decline, not the signal. The reaction to each of the two reports was about 25 pips, indicating very weak movements, as we warned on Thursday. The pair did not reach the target level of 1.0725, so the trade closed at breakeven.
On the hourly chart, the downtrend remains intact. We still expect the euro to show a pronounced decline, as the fundamental and macroeconomic background cannot support it at the moment. At the same time, we shouldn't expect the euro to fall everyday. We noticed that the market is actively trading only when there are fundamental reasons for it.
The key levels on the 5M chart are 1.0568, 1.0611-1.0618, 1.0668, 1.0725, 1.0767-1.0781, 1.0835, 1.0896-1.0904, 1.0940, 1.0971-1.0981, 1.1011, 1.1043, 1.1091. On Monday, there are no events lined up in the European Union or the U.S., not even secondary ones. We can expect a rather dull day (if there are no surprises). Volatility may be very weak.
1) Signal strength is determined by the time taken for its formation (either a bounce or level breach). A shorter formation time indicates a stronger signal.
2) If two or more trades around a certain level are initiated based on false signals, subsequent signals from that level should be disregarded.
3) In a flat market, any currency pair can produce multiple false signals or none at all. In any case, the flat trend is not the best condition for trading.
4) Trading activities are confined between the onset of the European session and mid-way through the U.S. session, after which all open trades should be manually closed.
5) On the 30-minute timeframe, trades based on MACD signals are only advisable amidst substantial volatility and an established trend, confirmed either by a trendline or trend channel.
6) If two levels lie closely together (ranging from 5 to 15 pips apart), they should be considered as a support or resistance zone.
Support and Resistance price levels can serve as targets when buying or selling. You can place Take Profit levels near them.
Red lines represent channels or trend lines, depicting the current market trend and indicating the preferable trading direction.
The MACD(14,22,3) indicator, encompassing both the histogram and signal line, acts as an auxiliary tool and can also be used as a signal source.
Significant speeches and reports (always noted in the news calendar) can profoundly influence the price dynamics. Hence, trading during their release calls for heightened caution. It may be reasonable to exit the market to prevent abrupt price reversals against the prevailing trend.
Beginning traders should always remember that not every trade will yield profit. Establishing a clear strategy coupled with sound money management is the cornerstone of sustained trading success.
*La presente analisi del mercato ha un carattere esclusivamente informativo e non rappresenta una guida per l`effettuazione di una transazione.
Le recensioni analitiche di InstaSpot ti renderanno pienamente consapevole delle tendenze del mercato! Essendo un cliente InstaSpot, ti viene fornito un gran numero di servizi gratuiti per il trading efficiente.


