


La leggenda nel team InstaSpot!!
Legenda! Pensi che sia troppo patetico? Ma come dobbiamo chiamare un uomo, che è diventato il primo dell'Asia a vincere il campionato mondiale di scacchi a 18 anni e che è diventato il primo Gran Maestro indiano a 19? Fu l'inizio di un duro cammino verso il titolo di campione del mondo, l'uomo che divenne per sempre una parte della storia di scacchi. Un'altra leggenda nel team InstaSpot!


Il Borussia è una delle squadre di calcio più titolate in Germania, che ha ripetutamente dimostrato ai tifosi che lo spirito di competizione e leadership porta al successo. Fai trading nello stesso modo in cui lo fanno i professionisti dello sport - fiduciosamente e attivamente. Segui il Borussia FC e sii avanti con InstaSpot!

Trend analysis (Fig. 1).
The GBP/USD currency pair may move upward from the level of 1.2739 (closing of yesterday's daily candle) to 1.2756, the 85.4% pullback level (blue dotted line). In the case of testing this level, a downward movement is possible with a target of 1.2733, the historical support level (blue dotted line). From this level, the upward trend may resume.
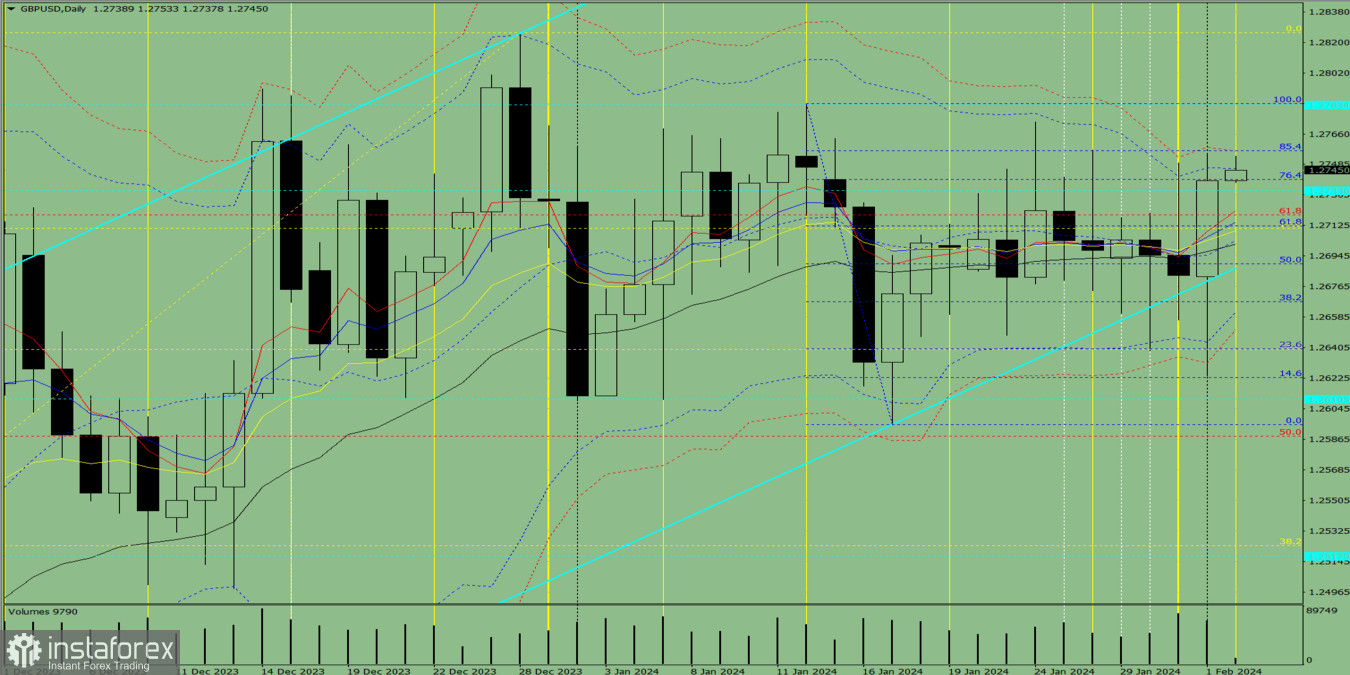
Fig. 1 (daily chart).
Comprehensive analysis:
General conclusion: Today, the price may move upward from the level of 1.2739 (closing of yesterday's daily candle) to 1.2756, the 85.4% pullback level (blue dotted line). In the case of testing this level, a downward movement is possible with a target of 1.2733, the historical support level (blue dotted line). From this level, the upward trend may resume.
Alternatively, the price may move upward from the level of 1.2739 (closing of yesterday's daily candlestick) to 1.2756, the 85.4% pullback level (blue dotted line). In the case of testing this level, a continued upward movement is possible.
*La presente analisi del mercato ha un carattere esclusivamente informativo e non rappresenta una guida per l`effettuazione di una transazione.
Le recensioni analitiche di InstaSpot ti renderanno pienamente consapevole delle tendenze del mercato! Essendo un cliente InstaSpot, ti viene fornito un gran numero di servizi gratuiti per il trading efficiente.


