


Nella nostra squadra ci sono più di 7.000.000 trader! Ogni giorno ci impegniamo a far sì che il trading migliori. Conseguiamo grandi risultati e ci muoviamo in avanti.
Il riconoscimento da parte di milioni di trader in tutto il mondo rappresenta l'alta valutazione della nostra attività! Voi avete fatto la vostra scelta e noi faremo la nostra al fine di soddisfare le vostre aspettative!
Assieme siamo una grande squadra!
InstaSpot. Siamo orgogliosi di lavorare per voi!


Attore, campione del mondo di lotta libera e semplicemente un vero maciste russo! Persona venuta dal nulla. Persona che rispecchia i nostri obiettivi. Il segreto del successo di Taktarov consiste nel mirare continuamente al suo scopo.
Dischiudi anche tu tutti gli aspetti del tuo talento! Impara, prova, sbaglia, ma non fermarti!
InstaSpot - la storia delle tue vittorie inizia qui!


The probability that the Federal Reserve System will not make changes to the current parameters of credit and monetary policy at the December meeting is approaching 100%, according to CME Group data.
However, the Federal Reserve will not start reducing the interest rate, at least not before the second half of next year. The Fed leadership still believes that there are few arguments in favor of inflation being on a "smooth path" to the target level of 2%. According to economists, the pause in the Fed's interest rate hike cycle may prevent further dollar appreciation but does not necessarily lead to a significant decline.
The Fed has room, at least, to keep the interest rate at high levels for quite a long time. This is still a bullish fundamental factor for the dollar, especially if other major central banks start easing their policies earlier than the Fed.

From a technical point of view, the dollar index (CFD #USDX on the MT4 terminal) is attempting to break through the important resistance level of 104.45 (144 EMA on the daily chart) to return to the zone of the medium-term bullish market. However, for a definitive recovery of the upward trend, the price will need to overcome the zone of important short-term resistance levels: 105.22 (200 EMA on the 1-hour chart), 105.40 (50 EMA on the daily chart), 105.62 (200 EMA on the 4-hour chart).
However, long positions are likely to be opened after consolidation in the zone above the resistance level of 104.45, and the "fastest" signal here could be the breakout of the important short-term resistance level of 104.58 (200 EMA on the 15-minute chart).
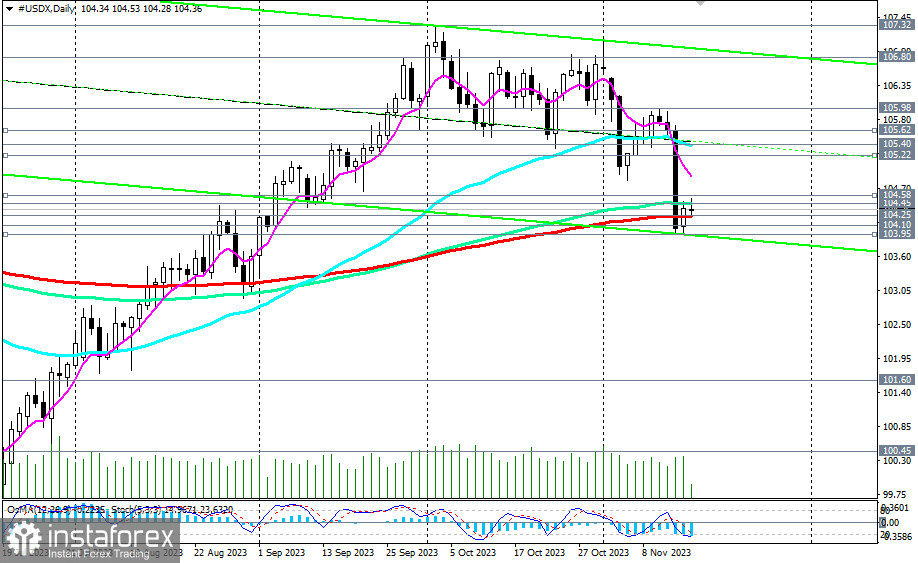
An alternative scenario would be associated with breaking through key support levels: 104.25 (200 EMA on the daily chart), 104.10 (50 EMA on the weekly chart), separating the medium-term bullish market from the bearish one, yesterday's local low of 103.95, and with further, deeper corrective decline to support levels: 100.45, 100.00, separating the long-term bullish market from the bearish one.
Support levels: 104.25, 104.10, 104.00, 103.00, 102.00, 101.60, 101.00, 100.45, 100.00
Resistance levels: 104.45, 104.58, 105.00, 105.40, 105.98, 106.00, 106.80, 107.00, 107.32, 107.80, 108.00, 109.00, 109.25
*La presente analisi del mercato ha un carattere esclusivamente informativo e non rappresenta una guida per l`effettuazione di una transazione.
Le recensioni analitiche di InstaSpot ti renderanno pienamente consapevole delle tendenze del mercato! Essendo un cliente InstaSpot, ti viene fornito un gran numero di servizi gratuiti per il trading efficiente.


