


Nella nostra squadra ci sono più di 7.000.000 trader! Ogni giorno ci impegniamo a far sì che il trading migliori. Conseguiamo grandi risultati e ci muoviamo in avanti.
Il riconoscimento da parte di milioni di trader in tutto il mondo rappresenta l'alta valutazione della nostra attività! Voi avete fatto la vostra scelta e noi faremo la nostra al fine di soddisfare le vostre aspettative!
Assieme siamo una grande squadra!
InstaSpot. Siamo orgogliosi di lavorare per voi!


Attore, campione del mondo di lotta libera e semplicemente un vero maciste russo! Persona venuta dal nulla. Persona che rispecchia i nostri obiettivi. Il segreto del successo di Taktarov consiste nel mirare continuamente al suo scopo.
Dischiudi anche tu tutti gli aspetti del tuo talento! Impara, prova, sbaglia, ma non fermarti!
InstaSpot - la storia delle tue vittorie inizia qui!

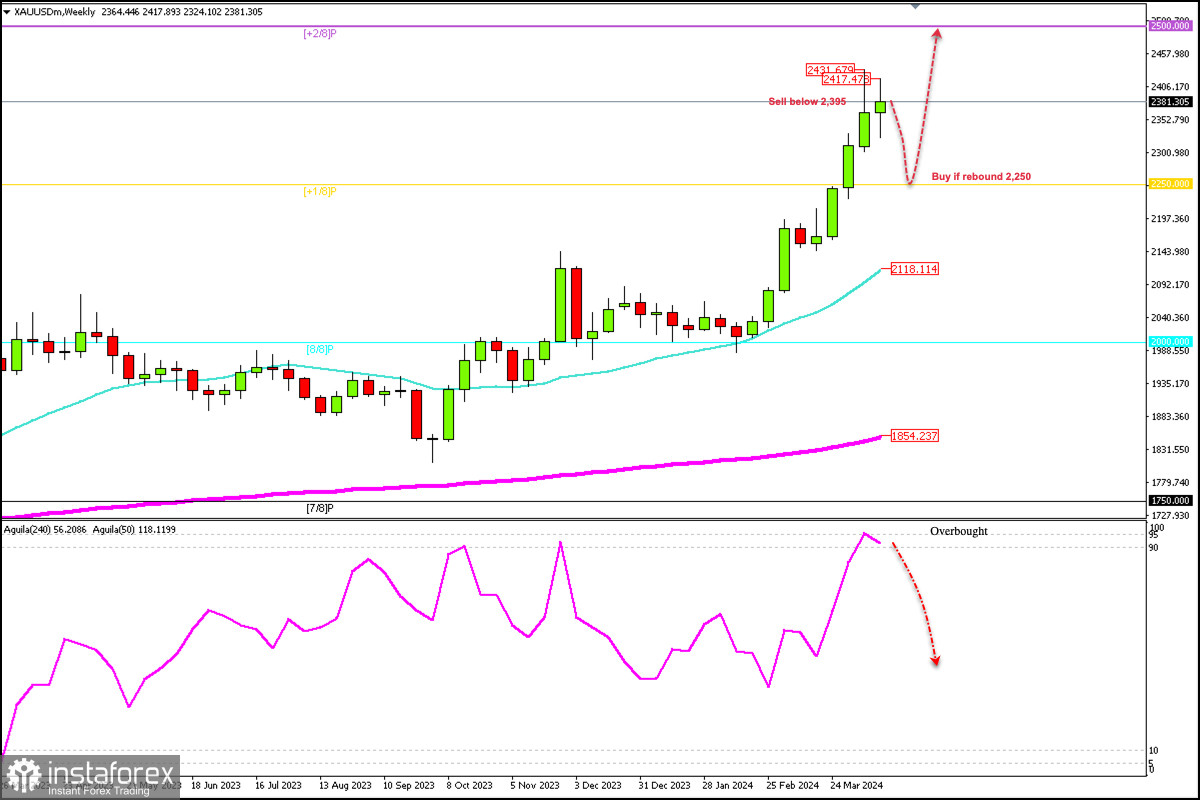
The weekly chart shows that gold maintains bullish momentum and has had strong gains for 10 consecutive weeks, but technically we are seeing an exhaustion of strength and it is likely that gold could fall in the coming days.
Gold has formed a Japanese candlestick pattern that left a long wick and a small body which means that there are resistance levels that prevent gold from a further rise. So, a trend reversal could occur.
Gold is showing signs of exhaustion and the outlook could be negative for the next few days if it trades below the psychological level of 2,400.
On the weekly chart, we see a consolidation for two weeks around the 2,400 area. Having reached the high of 2,431, we can observe a technical correction and now gold has reached another one-week high at 2,417. Since then, the metal has been showing another consolidation. It means that we could be facing the possibility of a trend change in the next weeks.
If gold consolidates above 2,400 in the coming days, then the bullish cycle could resume and the instrument could continue with its bullish potential and reach +2/8 Murray located at 2,500.
Technically, there is a strong bullish trend in gold, but a significant technical correction should occur on the weekly chart since we have observed bullish closes for several weeks. It indicates a negative week outlook for the next few days, so we could expect the price to fall towards 2,250. At that point, the price could make a technical rebound.
*La presente analisi del mercato ha un carattere esclusivamente informativo e non rappresenta una guida per l`effettuazione di una transazione.
Le recensioni analitiche di InstaSpot ti renderanno pienamente consapevole delle tendenze del mercato! Essendo un cliente InstaSpot, ti viene fornito un gran numero di servizi gratuiti per il trading efficiente.


