


The world of Bitcoin ETFs is experiencing a dramatic surge in investor interest, exemplified by VanEck's BTC ETF, which recently saw its trading volume skyrocket to over $300 million in a single day - ten times more than its previous peak. This leap follows VanEck's decision to lower its ETF fees, a move that has clearly resonated with investors.

While the entire ETF sector is buoyed by a green wave of bullish sentiment, BlackRock has emerged as the frontrunner, with its BTC ETF absorbing a staggering 58% of the week's inflows. Not to be outdone, VanEck's BTC ETF, launched on January 11, is also gaining traction, with its previous daily trading volume high recorded at $25.5 million, according to Yahoo Finance data.
The investment community's rally cry might as well be "everyone's got Bitcoin, so should I!" However, there is an underlying anxiety about how the market will react to an inevitable correction. Bitcoin's upcoming halving event is expected to bring another bullish cycle, yet questions remain about whether a price correction might occur before then.
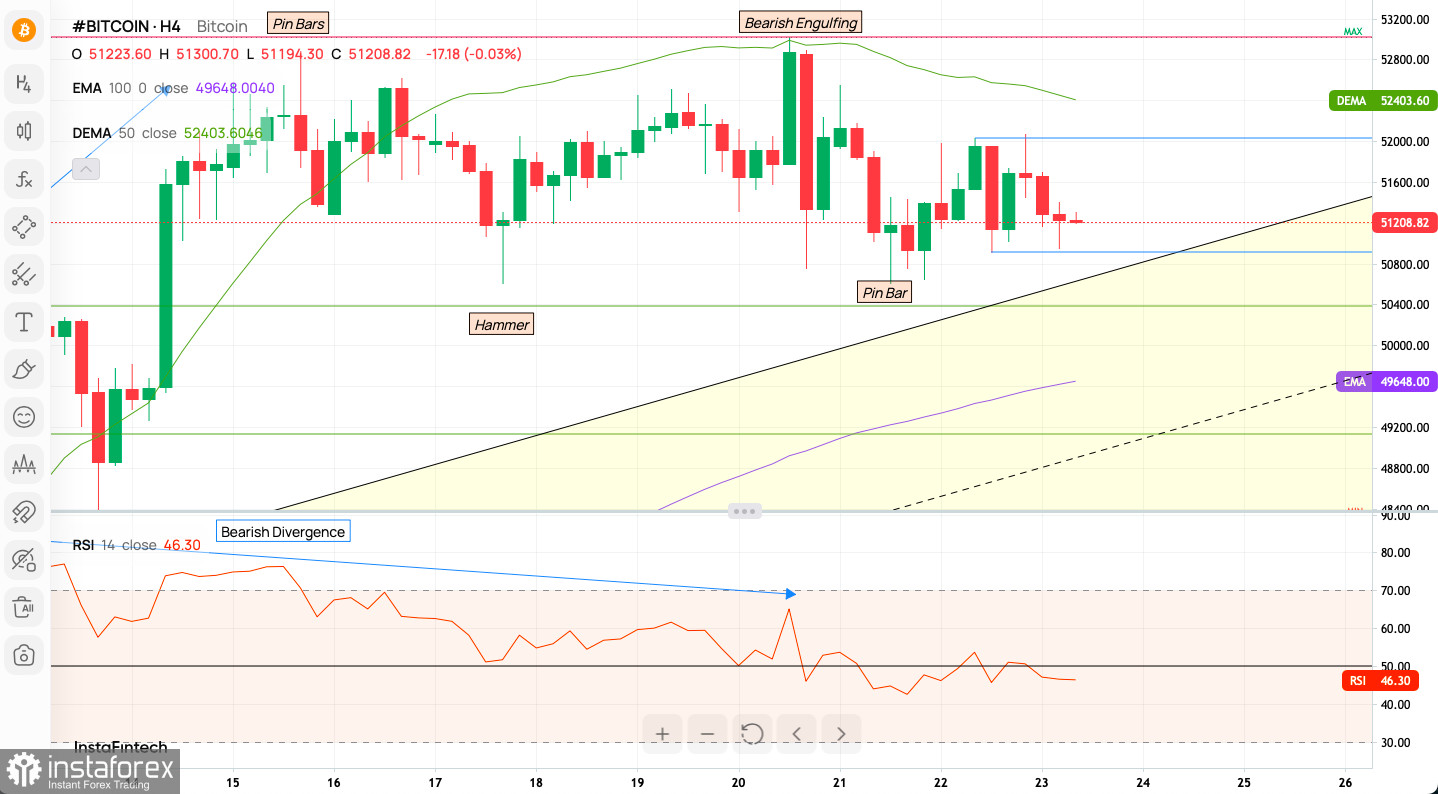
The BTC/USD H4 chart indicates a complex scenario. Despite bearish divergence on the RSI, indicating potential price weakness, the overall sentiment remains bullish. The majority of technical indicators and moving averages suggest a sell signal, but the sentiment scoreboard is overwhelmingly bullish, with a 73% bullish outlook against 27% bearish.
Summary: Bitcoin's chart shows a bullish trend with potential signs of reversal indicated by the Bearish Engulfing pattern and bearish divergence in RSI. The presence of bullish reversal patterns like the Hammer and Pin Bars suggests that there could be buying interest at lower levels within the channel.
Traffic Light Indicator:
Considering the mixed signals, a cautious approach would be warranted. Traders might look for confirmation of direction with either a bounce off the channel's support or a break below it to confirm a bearish reversal.
Weekly Pivot Points:
Pivot Points are key price levels used in technical analysis to identify potential trend reversals, support, and resistance levels in financial markets.
WR3 - $53,330
WR2 - $52,753
WR1 - $52,484
Weekly Pivot - $52,175
WS1 - $51,907
WS2 - $51,597
WS3 - $51,017
If Bitcoin maintains support above the DEMA 50 and breaks the EMA 100, we could see a push towards the upper channel boundary.
Conversely, if the bearish divergence leads to a price pullback, a break below the DEMA 50 could result in a move towards the lower channel boundary.
With VanEck's BTC ETF performing robustly in a competitive market, and the Bitcoin halving on the horizon, investors are navigating a market ripe with both opportunity and risk. As bullish sentiment persists, the question remains: will the market sustain its momentum, or will a correction reset expectations?
The begginers in forex trading need to be very careful when making decisions about entering the market. Before the release of important reports, it is best to stay out of the market to avoid being caught in sharp market fluctuations due to increased volatility. If you decide to trade during the news release, then always place stop orders to minimize losses.
Without placing stop orders, you can very quickly lose your entire deposit, especially if you do not use money management and trade large volumes. For successful trading, you need to have a clear trading plan and stay focues and disciplined. Spontaneous trading decision based on the current market situation is an inherently losing strategy for a scalper or daytrader.
*La presente analisi del mercato ha un carattere esclusivamente informativo e non rappresenta una guida per l`effettuazione di una transazione.
Le recensioni analitiche di InstaSpot ti renderanno pienamente consapevole delle tendenze del mercato! Essendo un cliente InstaSpot, ti viene fornito un gran numero di servizi gratuiti per il trading efficiente.


