


La leggenda nel team InstaSpot!!
Legenda! Pensi che sia troppo patetico? Ma come dobbiamo chiamare un uomo, che è diventato il primo dell'Asia a vincere il campionato mondiale di scacchi a 18 anni e che è diventato il primo Gran Maestro indiano a 19? Fu l'inizio di un duro cammino verso il titolo di campione del mondo, l'uomo che divenne per sempre una parte della storia di scacchi. Un'altra leggenda nel team InstaSpot!


Il Borussia è una delle squadre di calcio più titolate in Germania, che ha ripetutamente dimostrato ai tifosi che lo spirito di competizione e leadership porta al successo. Fai trading nello stesso modo in cui lo fanno i professionisti dello sport - fiduciosamente e attivamente. Segui il Borussia FC e sii avanti con InstaSpot!

Data on the UK labor market reflected an increase in the unemployment rate to 4.3%, which corresponds to analysts' forecasts. The number of employed individuals decreased by 207,000 in July, while a decrease of 185,000 was expected. These labor market data turned out to be far from favorable; however, the British pound did not react as expected.
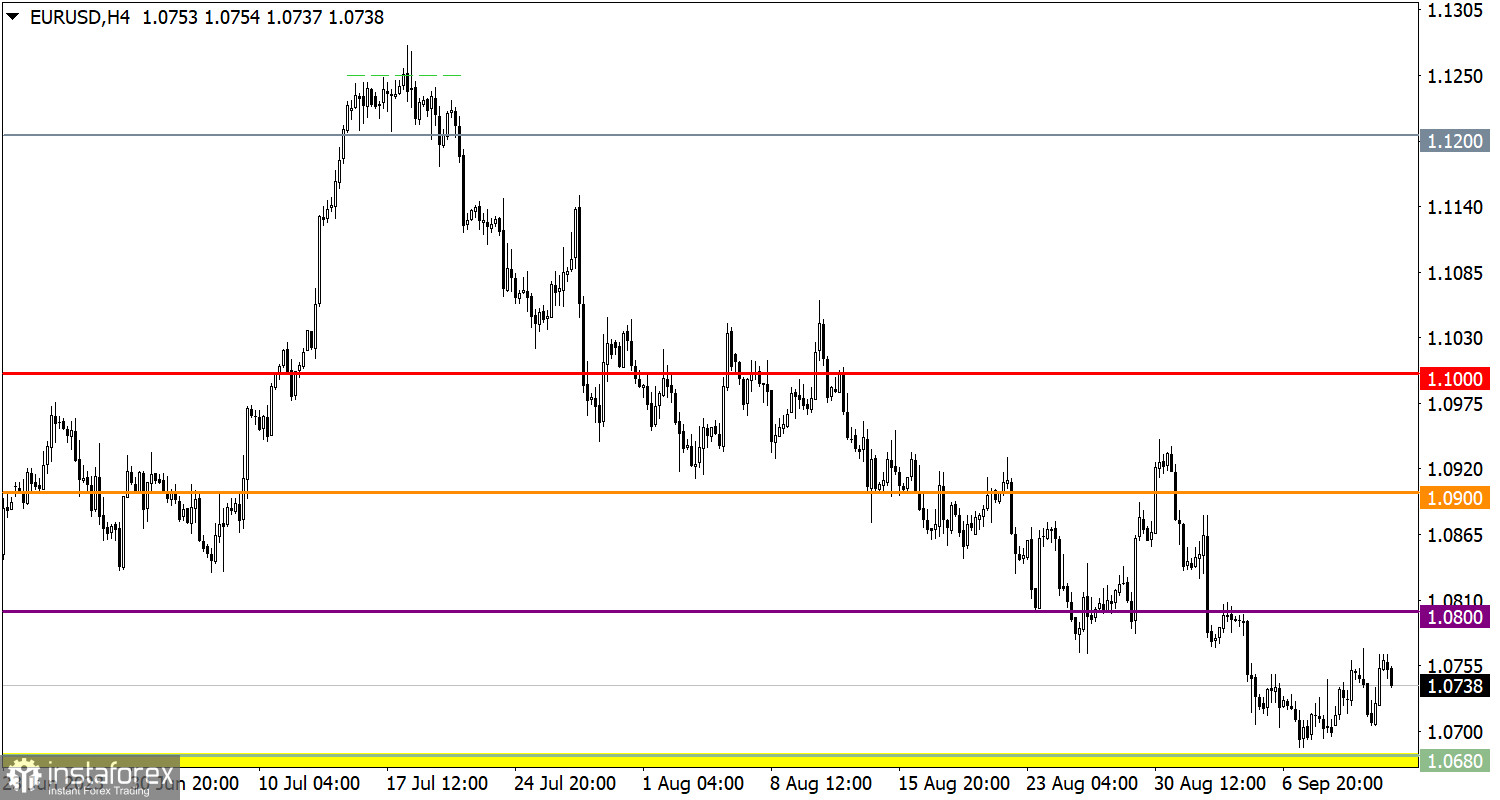
The EUR/USD currency pair has formed a pullback from the zone of interaction of trading forces at 1.0650/1.0680. This movement did not lead to radical changes, as a downward cycle continues in the market.
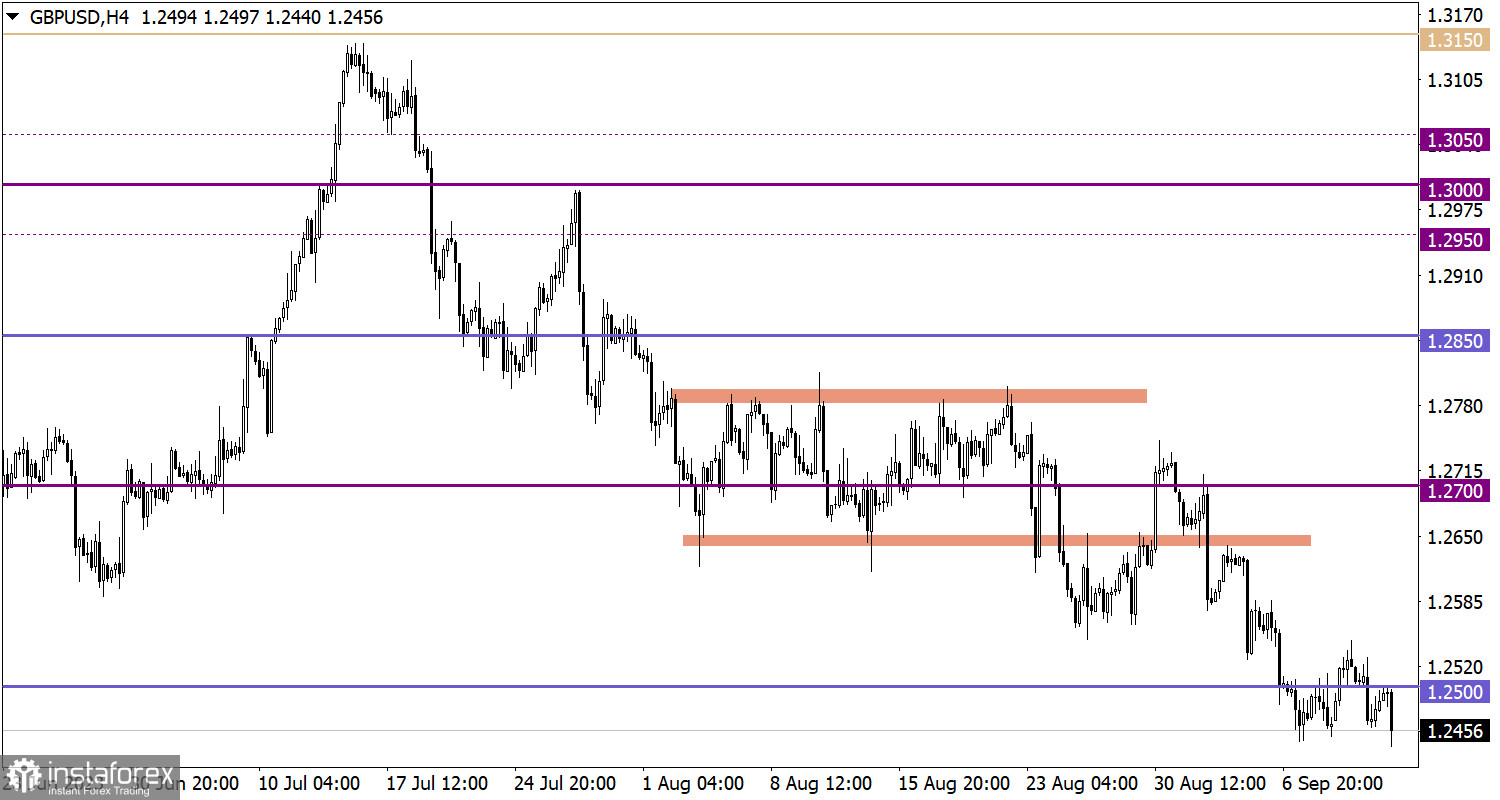
The GBP/USD currency pair is in a stagnant state near the base of the current downward cycle. This has resulted in fluctuations within a 100-point range in the market.

During the European trading session, important statistical data on industrial production in the United Kingdom and the European Union are being released. However, these data will take a back seat as, during the American trading session, inflation figures in the United States are expected to be published, which may provide insights into the future actions of the Federal Reserve.
If we consider the pullback as the initial phase of the euro's recovery, we expect a technical signal for an increase in long positions after the price holds above the 1.0800 mark. There is still a high probability that the price will return to the level from which the downward cycle began, especially if the price remains below the 1.0650 level, which could lead to its continuation.
In this situation, traders pay special attention to the price range between 1.2450 and 1.2550. If the price remains above or below any of these levels, it may indicate the completion of the flat phase. Ultimately, this could provide a signal regarding the direction of future price movement.
The candlestick chart type is white and black graphic rectangles with lines above and below. With a detailed analysis of each individual candle, you can see its characteristics relative to a particular time frame: opening price, closing price, intraday high and low.
Horizontal levels are price coordinates, relative to which a price may stop or reverse its trajectory. In the market, these levels are called support and resistance.
Circles and rectangles are highlighted examples where the price reversed in history. This color highlighting indicates horizontal lines that may put pressure on the asset's price in the future.
The up/down arrows are landmarks of the possible price direction in the future.
*La presente analisi del mercato ha un carattere esclusivamente informativo e non rappresenta una guida per l`effettuazione di una transazione.
Le recensioni analitiche di InstaSpot ti renderanno pienamente consapevole delle tendenze del mercato! Essendo un cliente InstaSpot, ti viene fornito un gran numero di servizi gratuiti per il trading efficiente.


