Bitcoin's Rally and ETF Interest: A New Era for Cryptocurrency
Rising Confidence in Bitcoin: Reflecting on Recent Price Surge and ETF Interests
The world of cryptocurrency has recently been abuzz with significant developments. Bitcoin, the pioneering digital currency, has experienced a notable rally, with its price nearing $53,000. This surge is primarily driven by substantial inflows into spot Bitcoin Exchange-Traded Funds (ETFs), indicating a growing investor interest.
Key Developments in Bitcoin's Landscape
- Bitcoin ETFs Gaining Traction: Recent hours have seen a push from large banks for a share in the burgeoning Bitcoin ETF market. This move demonstrates an increasing mainstream financial sector interest in cryptocurrencies.
- Technological Robustness: New research from Coin Metrics reveals that Bitcoin (BTC) and Ethereum (ETH) are now immune to 51% and 34% attacks, marking a significant advancement in their technological security.
- Market's Response: The price of Bitcoin continues to show resilience and strength, reflecting confidence among both retail and institutional investors in the digital currency's future.
Understanding the Implications
These developments are crucial for several reasons. The growing interest in Bitcoin ETFs is not just a trend among individual investors but also among major financial institutions, signaling a shift towards broader acceptance of cryptocurrencies in traditional finance. The technological advancements enhancing the security of Bitcoin further solidify its position as a reliable digital asset.
BTC/USD Technical Outlook:
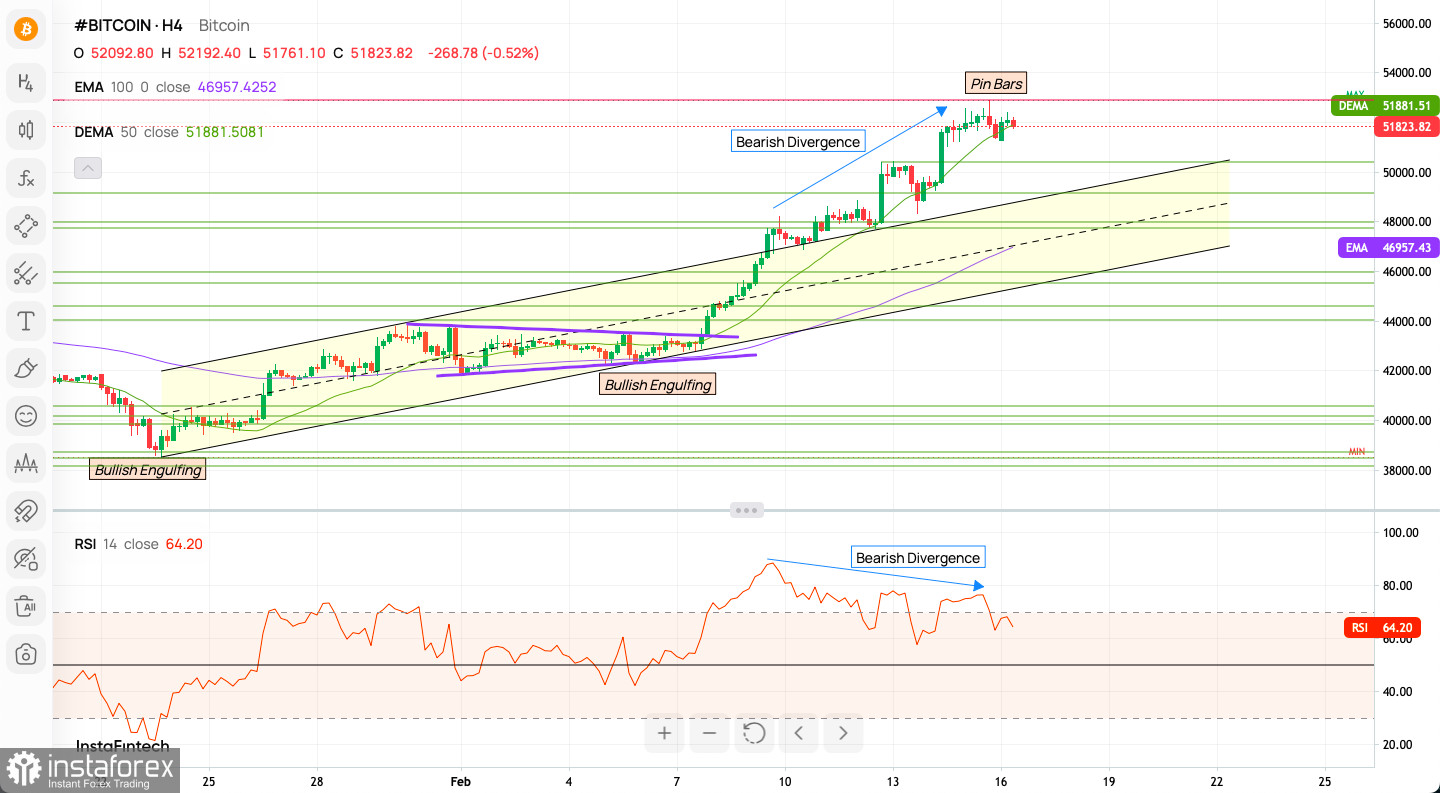
The BTC/USD pair has set a fresh annual peak at $52,565, marking a significant milestone as the bullish drive propels the cryptocurrency market forward. Currently, the immediate technical support is established around $50,384. Although the momentum remains robust and favorable, there is a noticeable decline from highly overbought conditions on the H4 chart, as evidenced by the bearish divergence between the price and the momentum oscillator. Despite these short-term indicators, the overarching trend on larger time frames continues to be upward, suggesting sustained bullish sentiments in the broader market landscape.
Technical Indicators and Patterns:
- Bullish Engulfing Patterns: Earlier in the chart, there are bullish engulfing candlestick patterns, which are typically considered a bullish reversal signal. These patterns suggest that buyers have taken control from sellers.
- Bearish Divergence on RSI: There is a noted bearish divergence with the Relative Strength Index (RSI), where the price is making higher highs, but the RSI is making lower highs. This can often precede a reversal or a pullback in price as it indicates that the bullish momentum is waning.
- Pin Bars: The presence of pin bars (or long upper shadows) at the top of the uptrend suggests rejection of higher prices, which can be a signal of a potential reversal or consolidation.
- Channel: The price has been trading within an ascending channel, with the lower trendline supporting the price and the upper trendline acting as resistance.
- Moving Averages: The price is above both the 100-period EMA and the 50-period DEMA, which is typically a bullish sign. These moving averages may act as dynamic support in the event of a price retracement.
- Current RSI Level: The RSI is above 60 but below the overbought threshold of 70, suggesting that there is still bullish momentum, although it's starting to get into the higher territory where reversals can occur.
Potential Market Scenarios:
- Continuation of Uptrend:
- If the price remains above the 50-period DEMA and 100-period EMA, and the RSI stays above 60 without reaching overbought levels, this could indicate the continuation of the uptrend.
- A bounce from the lower ascending channel line could also signal the continuation of the trend.
- Reversal or Pullback:
- If the bearish divergence on the RSI plays out, we could see a reversal or a pullback. A break below the ascending channel or the moving averages could confirm this scenario.
- If the price consistently starts closing below the 50-period DEMA, it might suggest a change in the trend.
Key Levels to Watch:
- Support Levels:
- The lower boundary of the ascending channel.
- The 50-period DEMA and 100-period EMA, which have provided support in the past.
- Resistance Levels:
- The upper boundary of the ascending channel.
- Psychological levels such as $52,000 and $55,000, which may also correspond to historical resistance areas.
Conclusion:
The market is currently showing bullish signs but with caution due to the bearish divergence on the RSI. Traders should monitor these technical indicators and patterns closely for signs of either a continuation of the uptrend or a potential reversal.
Useful Links
Important Notice
The begginers in forex trading need to be very careful when making decisions about entering the market. Before the release of important reports, it is best to stay out of the market to avoid being caught in sharp market fluctuations due to increased volatility. If you decide to trade during the news release, then always place stop orders to minimize losses.
Without placing stop orders, you can very quickly lose your entire deposit, especially if you do not use money management and trade large volumes. For successful trading, you need to have a clear trading plan and stay focues and disciplined. Spontaneous trading decision based on the current market situation is an inherently losing strategy for a scalper or daytrader.
#instaforex #analysis #sebastianseliga
*La presente analisi del mercato ha un carattere esclusivamente informativo e non rappresenta una guida per l`effettuazione di una transazione.
Approfittati subito dei consigli degli analisti
Deposita i fondi sul conto di trading
Apri un conto di trading
Le recensioni analitiche di InstaSpot ti renderanno pienamente consapevole delle tendenze del mercato! Essendo un cliente InstaSpot, ti viene fornito un gran numero di servizi gratuiti per il trading efficiente.
Guadagna sulle variazioni del tasso di criptovaluta con InstaSpot
Scarica MetaTrader 4 e apri la tua prima transazione