


Nella nostra squadra ci sono più di 7.000.000 trader! Ogni giorno ci impegniamo a far sì che il trading migliori. Conseguiamo grandi risultati e ci muoviamo in avanti.
Il riconoscimento da parte di milioni di trader in tutto il mondo rappresenta l'alta valutazione della nostra attività! Voi avete fatto la vostra scelta e noi faremo la nostra al fine di soddisfare le vostre aspettative!
Assieme siamo una grande squadra!
InstaSpot. Siamo orgogliosi di lavorare per voi!


Attore, campione del mondo di lotta libera e semplicemente un vero maciste russo! Persona venuta dal nulla. Persona che rispecchia i nostri obiettivi. Il segreto del successo di Taktarov consiste nel mirare continuamente al suo scopo.
Dischiudi anche tu tutti gli aspetti del tuo talento! Impara, prova, sbaglia, ma non fermarti!
InstaSpot - la storia delle tue vittorie inizia qui!

Monday, as usual, was accompanied by an empty macroeconomic calendar. No significant statistical data were published in the European Union, United Kingdom, or United States.
EUR/USD opened the trading week with an increase in the volume of long positions. As a result, the quote rose above the level of 1.0900, which may signal the possible end of the correction phase.
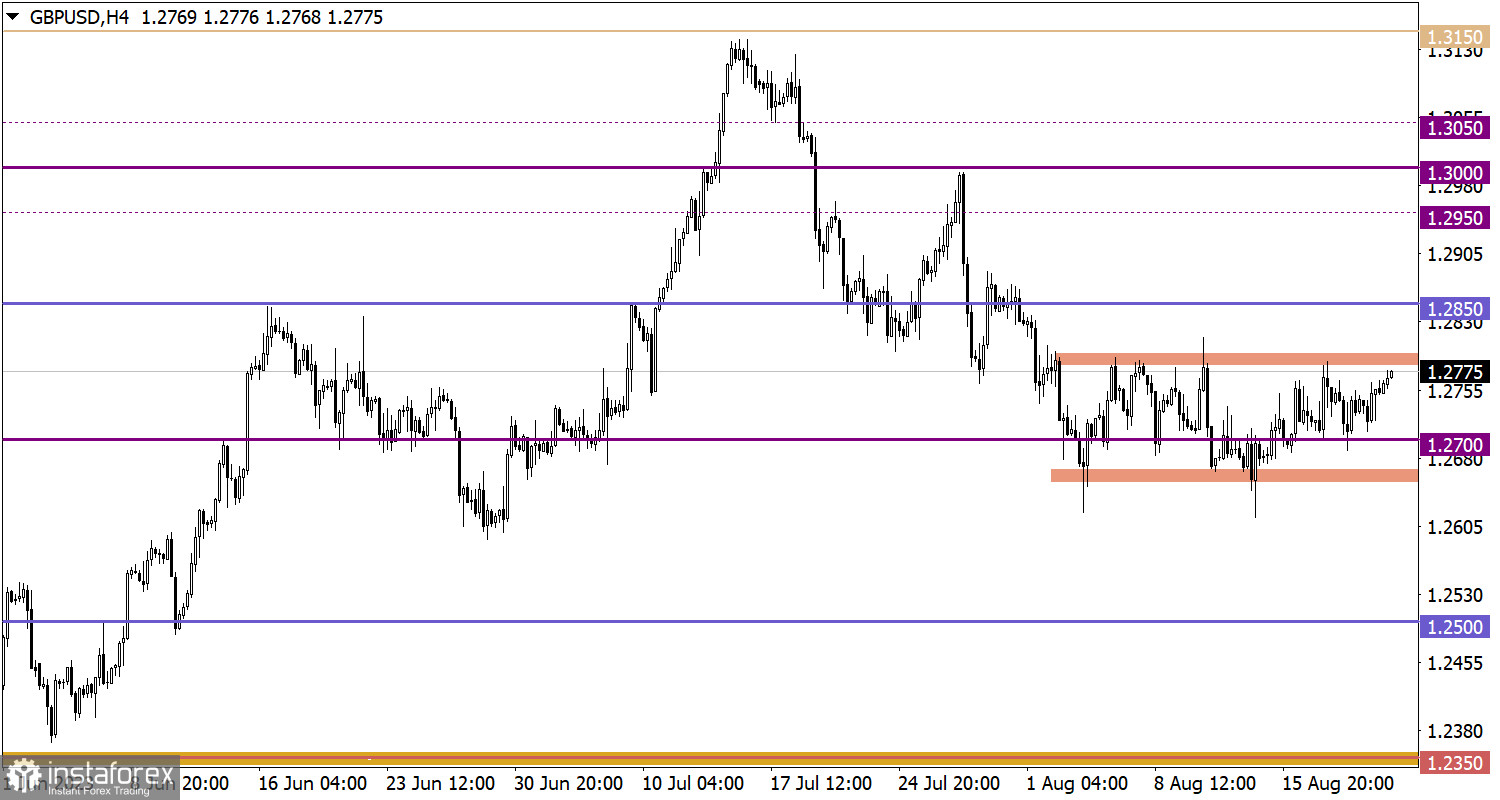
On the other hand, the GBP/USD currency pair has continued to move within a sideways range for the third consecutive week without significant changes. It is noted that recent price changes have caused an upward movement from the lower boundary of the range to the upper one, as can be observed on the chart.

Tuesday turned out to be almost the same as Monday, as the macroeconomic calendar remained practically empty. The only thing worth noting is the statistics on sales in the secondary housing market in the United States, where a decline in volumes is expected.
Stable maintenance of the price above the level of 1.0900 may have a positive effect on the euro rate. However, until we see a breach of the 1.0950 level, we cannot assert with absolute confidence that sellers have eased their pressure and that the correction movement will no longer resume in the market.
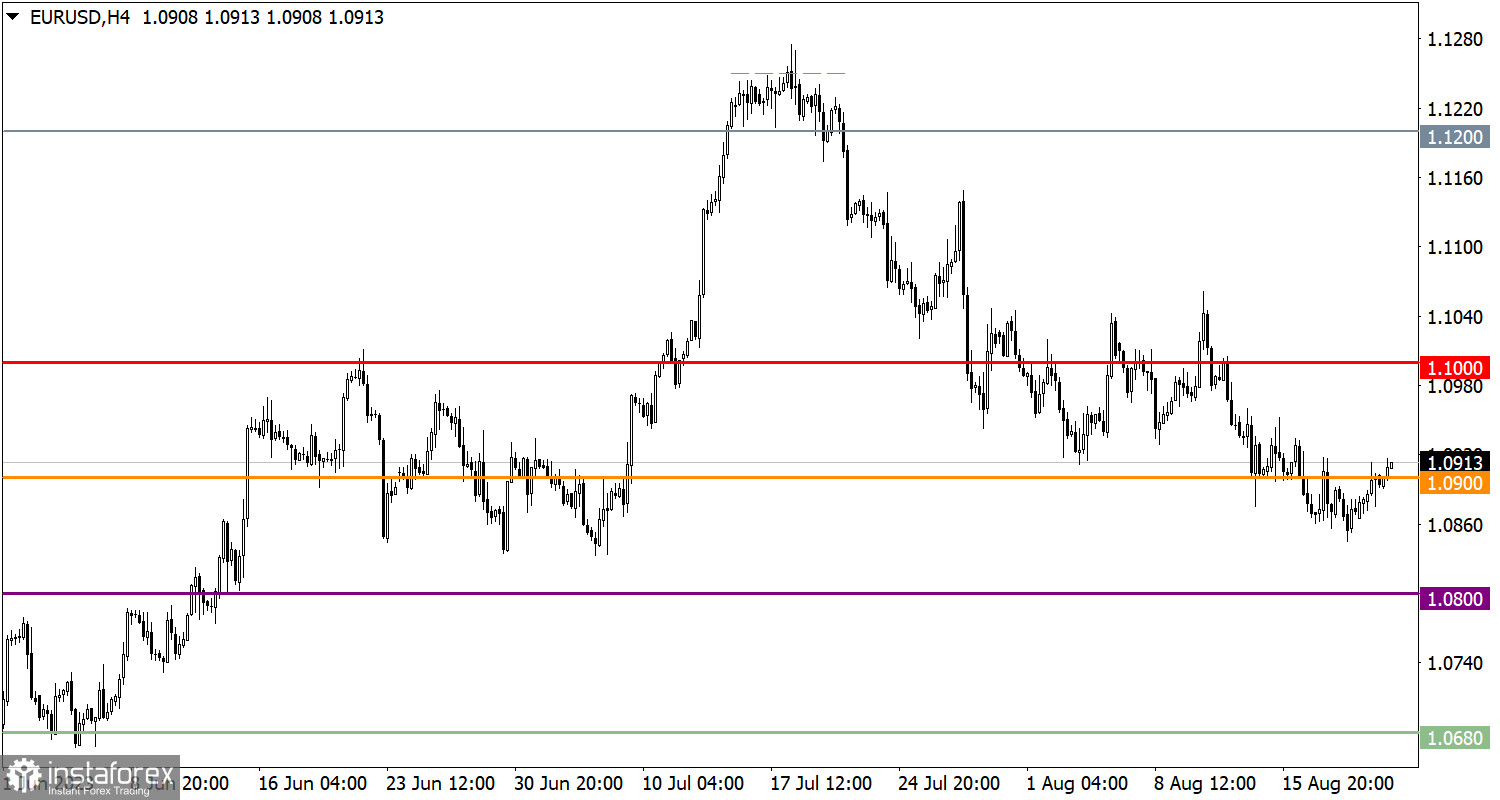
In this situation, traders prefer a breakout strategy, as this approach can clearly indicate the subsequent direction of market prices.
A decline will become relevant if the price consistently stays below the 1.2650 level. This condition could contribute to the continuation of a downward corrective movement.
A rise assumes a gradual recovery of the pound sterling's value relative to the current corrective movement. A primary technical signal of potential growth may appear if the price holds above the 1.2800 mark.
The candlestick chart type is white and black graphic rectangles with lines above and below. With a detailed analysis of each individual candle, you can see its characteristics relative to a particular time frame: opening price, closing price, intraday high and low.
Horizontal levels are price coordinates, relative to which a price may stop or reverse its trajectory. In the market, these levels are called support and resistance.
Circles and rectangles are highlighted examples where the price reversed in history. This color highlighting indicates horizontal lines that may put pressure on the asset's price in the future.
The up/down arrows are landmarks of the possible price direction in the future.
*La presente analisi del mercato ha un carattere esclusivamente informativo e non rappresenta una guida per l`effettuazione di una transazione.
Le recensioni analitiche di InstaSpot ti renderanno pienamente consapevole delle tendenze del mercato! Essendo un cliente InstaSpot, ti viene fornito un gran numero di servizi gratuiti per il trading efficiente.


