


La leggenda nel team InstaSpot!!
Legenda! Pensi che sia troppo patetico? Ma come dobbiamo chiamare un uomo, che è diventato il primo dell'Asia a vincere il campionato mondiale di scacchi a 18 anni e che è diventato il primo Gran Maestro indiano a 19? Fu l'inizio di un duro cammino verso il titolo di campione del mondo, l'uomo che divenne per sempre una parte della storia di scacchi. Un'altra leggenda nel team InstaSpot!


Il Borussia è una delle squadre di calcio più titolate in Germania, che ha ripetutamente dimostrato ai tifosi che lo spirito di competizione e leadership porta al successo. Fai trading nello stesso modo in cui lo fanno i professionisti dello sport - fiduciosamente e attivamente. Segui il Borussia FC e sii avanti con InstaSpot!

Top Insights:
Global Market Context
The Asia-Pacific indices show mixed trends, with China's indices down by about 0.50-0.60% and Japan's Nikkei 225 slightly up by 0.40%. Forex markets remain calm, with most currency pairs showing minimal changes. The USD strengthens, while the JPY weakens, as seen in the USDJPY pair's rise.

Political Tensions Affecting Markets
Recent events in North Korea, involving artillery shells fired into the sea, add to regional tensions. Such geopolitical factors can influence currency markets, impacting pairs like GBP/USD.
Technical Analysis: A Closer Look
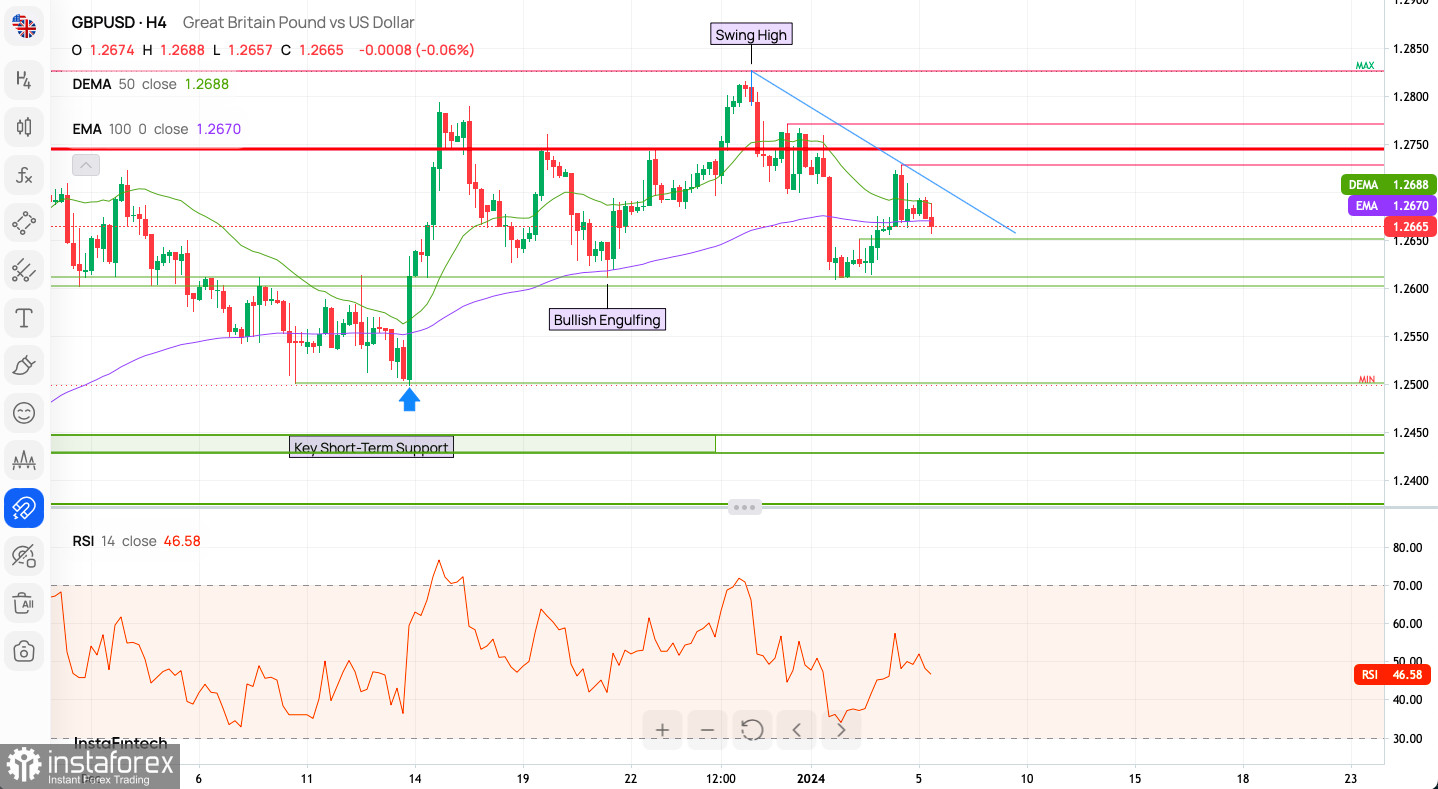
Indicator Insights
Market Sentiment and Indicator Signals
Weekly Pivot Points
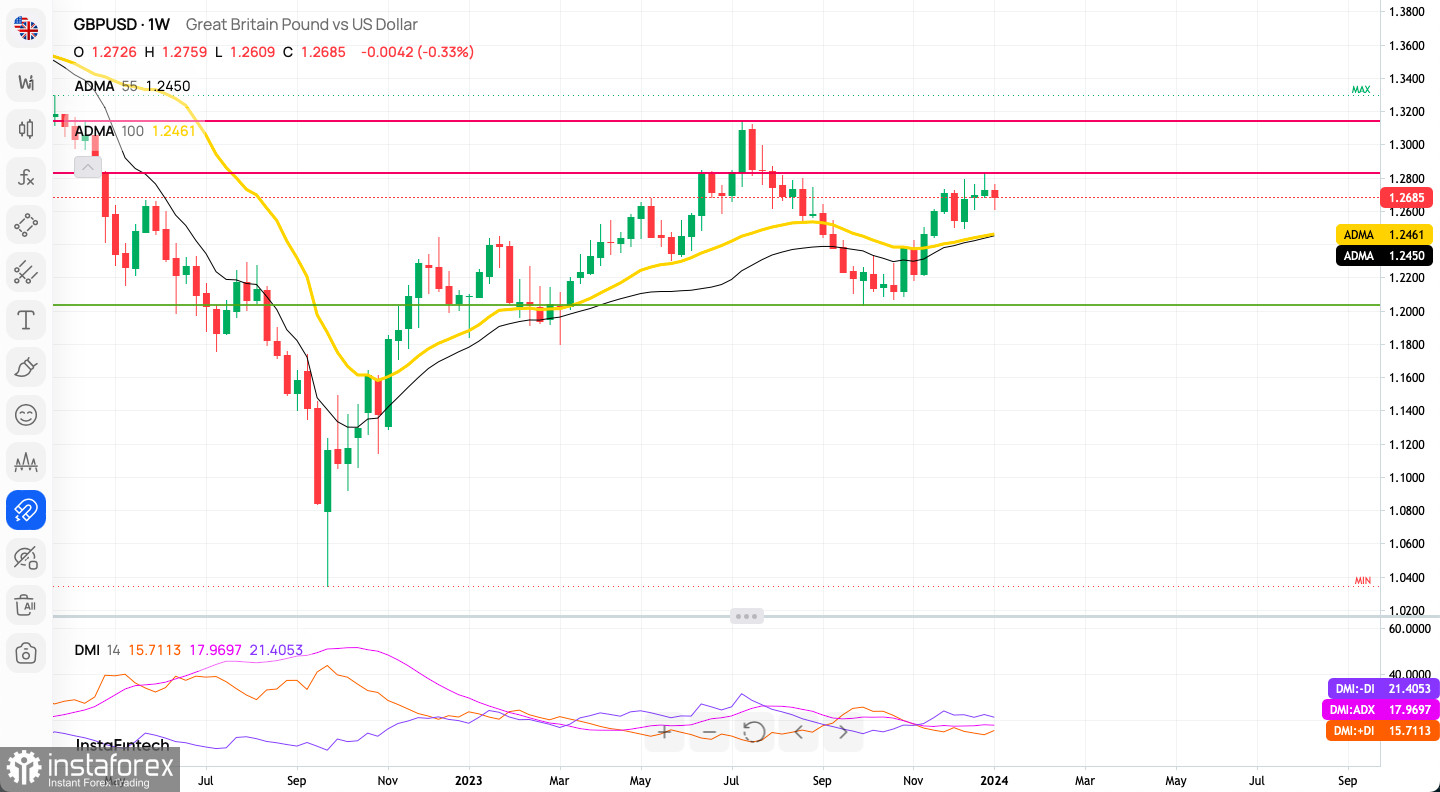
Long-Term Trading Perspective
Conclusion: A Balanced Approach
For bullish traders, maintaining positions above key support levels aligns with the long-term uptrend. However, bearish traders should watch for breaks below these levels. Always consider both technical and fundamental factors for a comprehensive approach to trading.
*La presente analisi del mercato ha un carattere esclusivamente informativo e non rappresenta una guida per l`effettuazione di una transazione.
Le recensioni analitiche di InstaSpot ti renderanno pienamente consapevole delle tendenze del mercato! Essendo un cliente InstaSpot, ti viene fornito un gran numero di servizi gratuiti per il trading efficiente.


