


Nella nostra squadra ci sono più di 7.000.000 trader! Ogni giorno ci impegniamo a far sì che il trading migliori. Conseguiamo grandi risultati e ci muoviamo in avanti.
Il riconoscimento da parte di milioni di trader in tutto il mondo rappresenta l'alta valutazione della nostra attività! Voi avete fatto la vostra scelta e noi faremo la nostra al fine di soddisfare le vostre aspettative!
Assieme siamo una grande squadra!
InstaSpot. Siamo orgogliosi di lavorare per voi!


Attore, campione del mondo di lotta libera e semplicemente un vero maciste russo! Persona venuta dal nulla. Persona che rispecchia i nostri obiettivi. Il segreto del successo di Taktarov consiste nel mirare continuamente al suo scopo.
Dischiudi anche tu tutti gli aspetti del tuo talento! Impara, prova, sbaglia, ma non fermarti!
InstaSpot - la storia delle tue vittorie inizia qui!

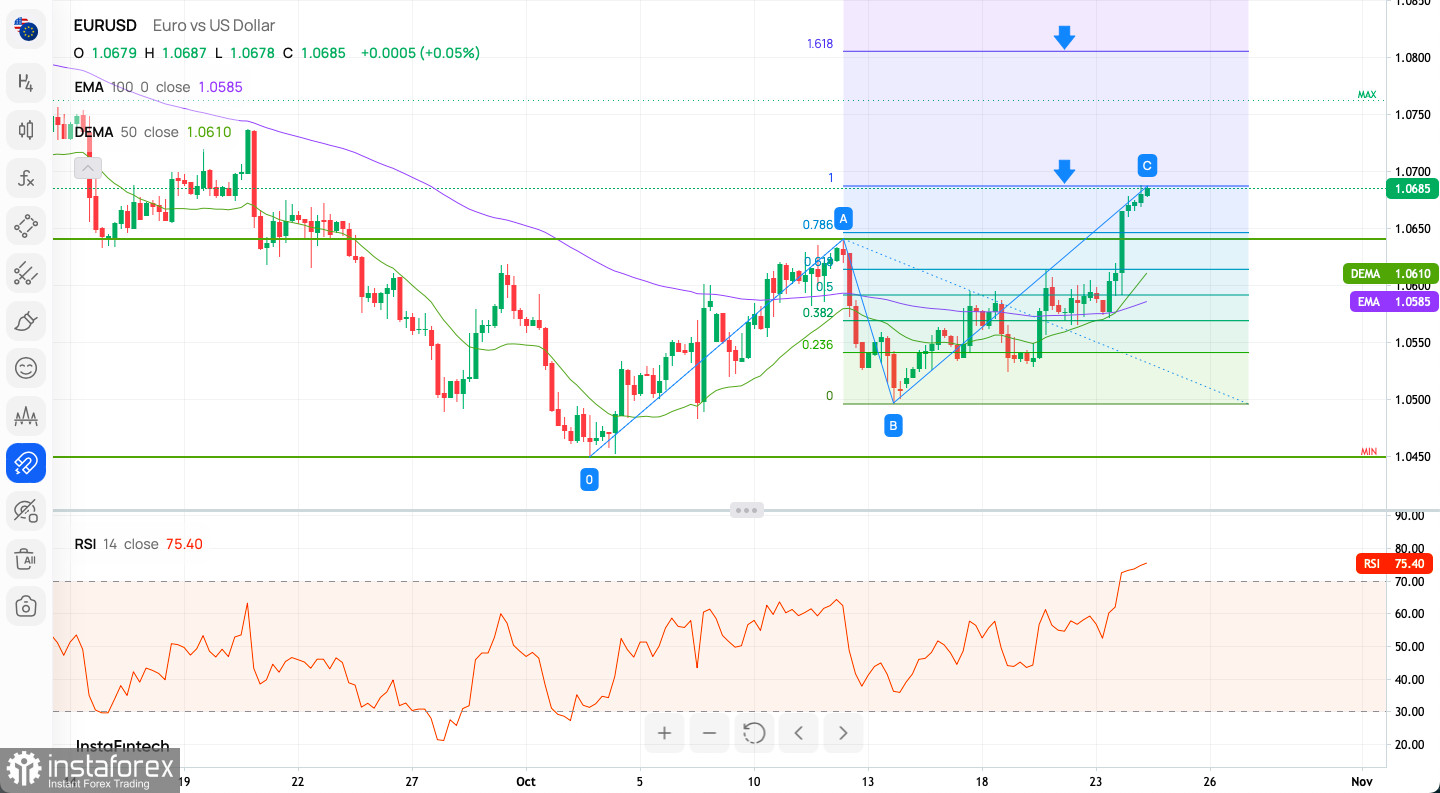
Technical Market Outlook:
The EUR/USD pair has been seen coming off the local high located at the level of 1.0695 after the ABC corrective pattern had been completed. Moreover, the wave C of the ABC pattern has hit the 100% extension of the wave A, so there is another indication of a possible down trend resumption. The nearest technical support is seen at the level of 1.0640 and the nearest technical resistance is located at the level of 1.0737. The next target for bulls is seen at the level of 1.0737 (swing high from September 20th). The next target for bears is the technical support located at the level of 1.0614 and 1.0595, but in order to do this, they need to break out below the intraday support. If the latter is violated, then the key short-term technical support located at the level of 1.0449 would be exposed for the test.
Weekly Pivot Points:
WR3 - 1.06231
WR2 - 1.06012
WR1 - 1.05872
Weekly Pivot - 1.05793
WS1 - 1.05653
WS2 - 1.05574
WS3 - 1.05355
Trading Outlook:
Since the beginning of October 2022 the EUR/USD is in the corrective cycle to the upside, but the main, long-term trend remains bearish. This corrective cycle was terminated at the level of 1.1286 which is 61% Fibonacci retracement level and the market reversed lower. The intermediate down move is 16 weeks long now and there is no indication if the down move termination yet. There is still a room to the downside on the RSI indication on the weekly time frame as well.
*La presente analisi del mercato ha un carattere esclusivamente informativo e non rappresenta una guida per l`effettuazione di una transazione.
Le recensioni analitiche di InstaSpot ti renderanno pienamente consapevole delle tendenze del mercato! Essendo un cliente InstaSpot, ti viene fornito un gran numero di servizi gratuiti per il trading efficiente.


