


La leggenda nel team InstaSpot!!
Legenda! Pensi che sia troppo patetico? Ma come dobbiamo chiamare un uomo, che è diventato il primo dell'Asia a vincere il campionato mondiale di scacchi a 18 anni e che è diventato il primo Gran Maestro indiano a 19? Fu l'inizio di un duro cammino verso il titolo di campione del mondo, l'uomo che divenne per sempre una parte della storia di scacchi. Un'altra leggenda nel team InstaSpot!


Il Borussia è una delle squadre di calcio più titolate in Germania, che ha ripetutamente dimostrato ai tifosi che lo spirito di competizione e leadership porta al successo. Fai trading nello stesso modo in cui lo fanno i professionisti dello sport - fiduciosamente e attivamente. Segui il Borussia FC e sii avanti con InstaSpot!

There was a lack of important macroeconomic data in the European Union, the United Kingdom, and the United States. As a result, investors and traders focused on the news flow.
Richmond Federal Reserve President Thomas Barkin expressed his opinion on Monday on the current situation in the U.S. economy. He noted that the banking sector is returning to normal, but the economy continues to show good results at the current interest rate level. Barkin also emphasized that there is no need to rush to ease monetary policy.

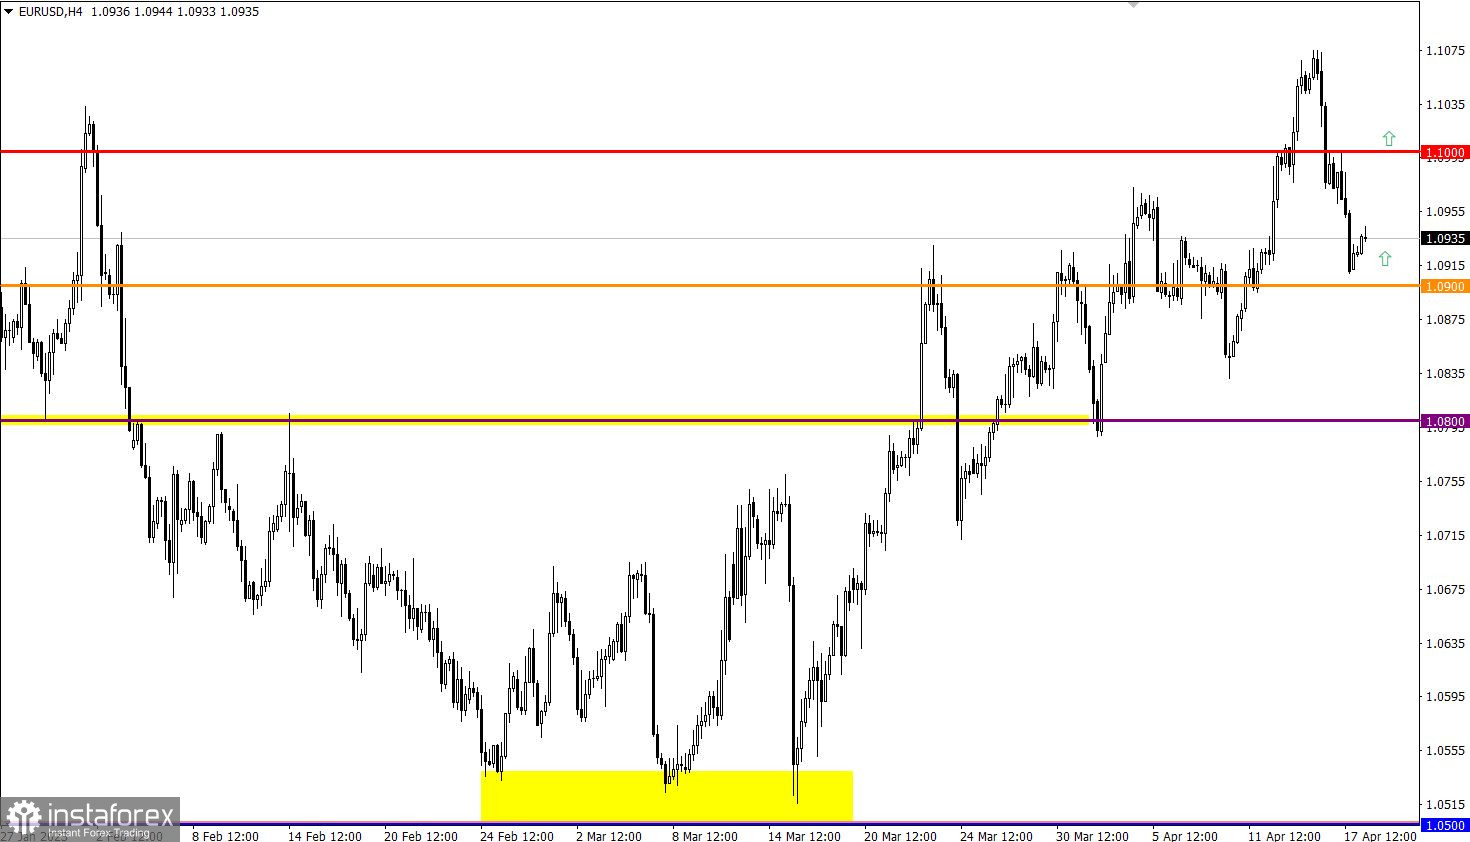
EUR/USD is in a correction stage, which has led to a loss of about 1.5% (160 points) from the local high of the medium-term trend. This strong price change over a short period of time leads to oversold conditions in short-term timeframes.
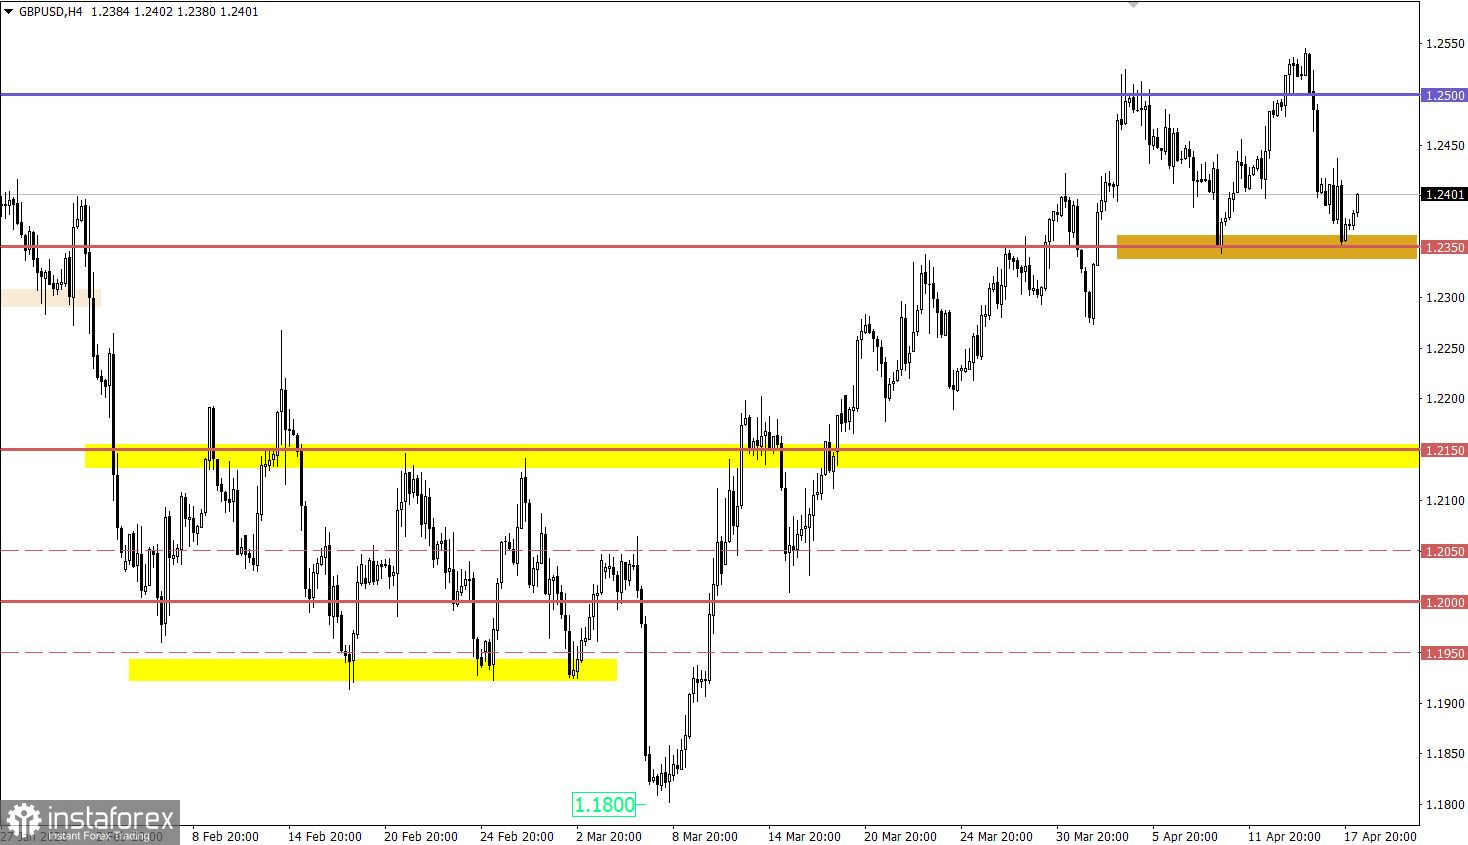
During the price pullback, GBP/USD approached the low of last week, which amounted to about 1.2350. In this case, this value plays the role of a variable support, relative to which there is a reduction in the volume of short positions.
At the beginning of the European session, data on the UK labor market was published. According to the report, the unemployment rate rose from 3.7% to 3.8%. However, employment in the country grew by 169,000, which is significantly higher than the forecast and previous figures.
If the euro does not fall below the value of 1.0900, the rate may gradually recover from the recent decline. However, if 1.0900 is broken, further price decline is possible towards 1.0850.
In order for the price to move from the pullback stage to a full-fledged correction, it is necessary to keep it below the value of 1.2350. Otherwise, this value will become a support, relative to which a subsequent gradual increase in the volume of long positions is possible. In this case, the quote will again return to the region of the local high of the medium-term trend.
The candlestick chart type is white and black graphic rectangles with lines above and below. With a detailed analysis of each individual candle, you can see its characteristics relative to a particular time frame: opening price, closing price, intraday high and low.
Horizontal levels are price coordinates, relative to which a price may stop or reverse its trajectory. In the market, these levels are called support and resistance.
Circles and rectangles are highlighted examples where the price reversed in history. This color highlighting indicates horizontal lines that may put pressure on the asset's price in the future.
The up/down arrows are landmarks of the possible price direction in the future.
*La presente analisi del mercato ha un carattere esclusivamente informativo e non rappresenta una guida per l`effettuazione di una transazione.
Le recensioni analitiche di InstaSpot ti renderanno pienamente consapevole delle tendenze del mercato! Essendo un cliente InstaSpot, ti viene fornito un gran numero di servizi gratuiti per il trading efficiente.


