


Nella nostra squadra ci sono più di 7.000.000 trader! Ogni giorno ci impegniamo a far sì che il trading migliori. Conseguiamo grandi risultati e ci muoviamo in avanti.
Il riconoscimento da parte di milioni di trader in tutto il mondo rappresenta l'alta valutazione della nostra attività! Voi avete fatto la vostra scelta e noi faremo la nostra al fine di soddisfare le vostre aspettative!
Assieme siamo una grande squadra!
InstaSpot. Siamo orgogliosi di lavorare per voi!


Attore, campione del mondo di lotta libera e semplicemente un vero maciste russo! Persona venuta dal nulla. Persona che rispecchia i nostri obiettivi. Il segreto del successo di Taktarov consiste nel mirare continuamente al suo scopo.
Dischiudi anche tu tutti gli aspetti del tuo talento! Impara, prova, sbaglia, ma non fermarti!
InstaSpot - la storia delle tue vittorie inizia qui!

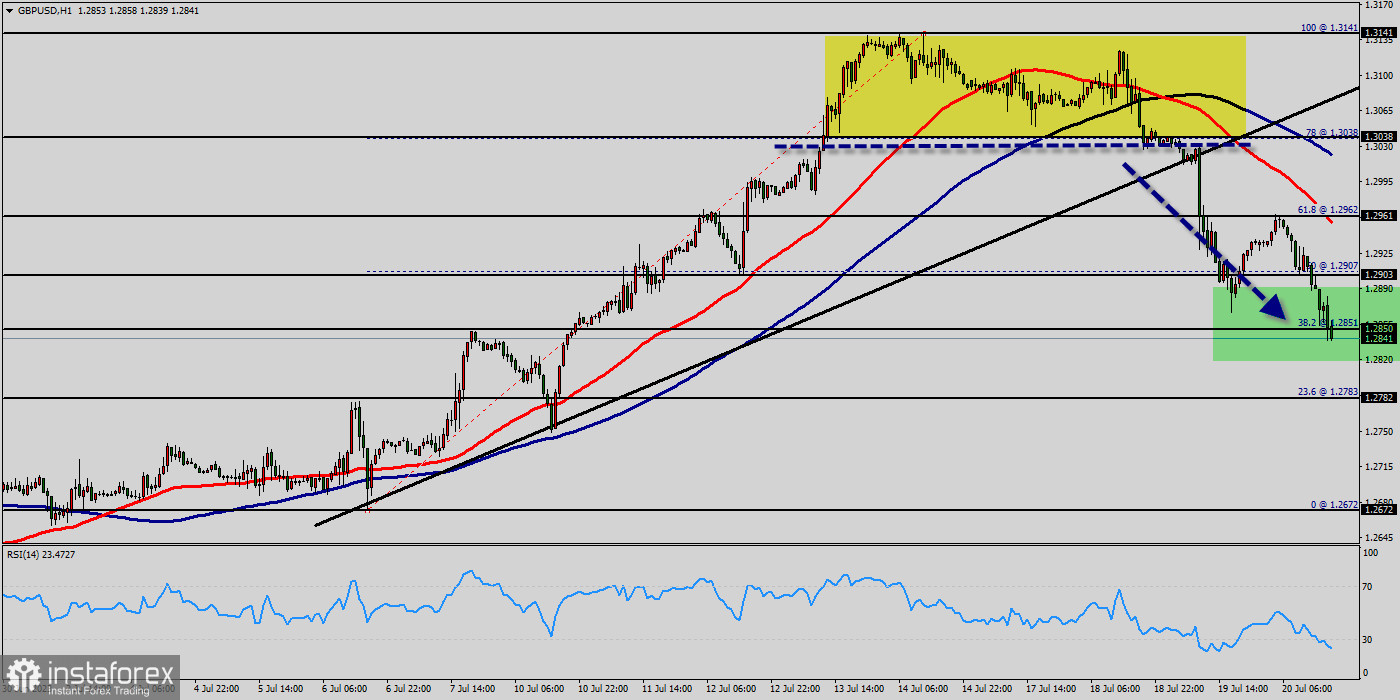
The British pound has dropped from the zone of 1.3038 - 1.2961, therefore now it looks as if we are trying to find selling opportunities at the prices of 1.2961 and 1.2903. The GBP to USD had a bullish start to the Thursday session, with the bulls eying a return to 1.2850. However, it is a quiet day ahead for the GBP to USD, with no economic indicators to influence.
The hourly chart showed the GBP to USD sat below the 1.2961 psychological resistance level. Looking at the EMAs, the GBP to USD remained below the 50-day (1.2961) EMAs, signaling bullish momentum over the near and long term.
Notably, the 50-day EMA continued to pull away from the 100-day EMA and reflected a bearish trend.Looking at the 14-Daily RSI, the 20 (oversold) reading sent bearish price signals, which aligned with the 50-day and 100-day EMAs.
A GBP to USD return to 1.2903 would give the bear a run at 1.2850 to bring the lower level of the 1.2961 and 13038 resistance band into view. The GBP to USD would need to avoid a fall to 1.2850 and 1.2803 support band to support a bullish session.
The GBP/USD pair fell sharply from the level of 1.2961 towards 1.2850. Now, the price is set at 1.2850. The resistance is seen at the level of 1.2961 and 1.3038. Moreover, the price area of 1.2961 and 1.3038 remains a significant resistance zone.
Therefore, there is a possibility that the GBP/USD pair will move downside and the structure of a fall does not look corrective. The trend is still below the 100 EMA for that the bearish outlook remains the same as long as the 100 EMA is headed to the downside.
Thus, amid the previous events, the price is still moving between the levels of 1.2961 and 1.2803. If the GBP/USD pair fails to break through the resistance level of 1.2961, the market will decline further to 1.2803 as as the first target.
This would suggest a bearish market because the RSI indicator is still in a negative spot and does not show any trend-reversal signs. The pair is expected to drop lower towards at least 1.2766 so as to test the daily support 2. On the contrary, if a breakout takes place at the resistance level of 1.3038, then this scenario may become invalidated.
*La presente analisi del mercato ha un carattere esclusivamente informativo e non rappresenta una guida per l`effettuazione di una transazione.
Le recensioni analitiche di InstaSpot ti renderanno pienamente consapevole delle tendenze del mercato! Essendo un cliente InstaSpot, ti viene fornito un gran numero di servizi gratuiti per il trading efficiente.


