


Nella nostra squadra ci sono più di 7.000.000 trader! Ogni giorno ci impegniamo a far sì che il trading migliori. Conseguiamo grandi risultati e ci muoviamo in avanti.
Il riconoscimento da parte di milioni di trader in tutto il mondo rappresenta l'alta valutazione della nostra attività! Voi avete fatto la vostra scelta e noi faremo la nostra al fine di soddisfare le vostre aspettative!
Assieme siamo una grande squadra!
InstaSpot. Siamo orgogliosi di lavorare per voi!


Attore, campione del mondo di lotta libera e semplicemente un vero maciste russo! Persona venuta dal nulla. Persona che rispecchia i nostri obiettivi. Il segreto del successo di Taktarov consiste nel mirare continuamente al suo scopo.
Dischiudi anche tu tutti gli aspetti del tuo talento! Impara, prova, sbaglia, ma non fermarti!
InstaSpot - la storia delle tue vittorie inizia qui!

Details of the economic calendar for August 8
Monday was traditionally accompanied by an empty macroeconomic calendar. Important statistics in Europe, the United Kingdom, and the United States were not published. Due to the lack of anything interesting, investors and traders took a wait-and-see position in the market.
Analysis of trading charts from August 8
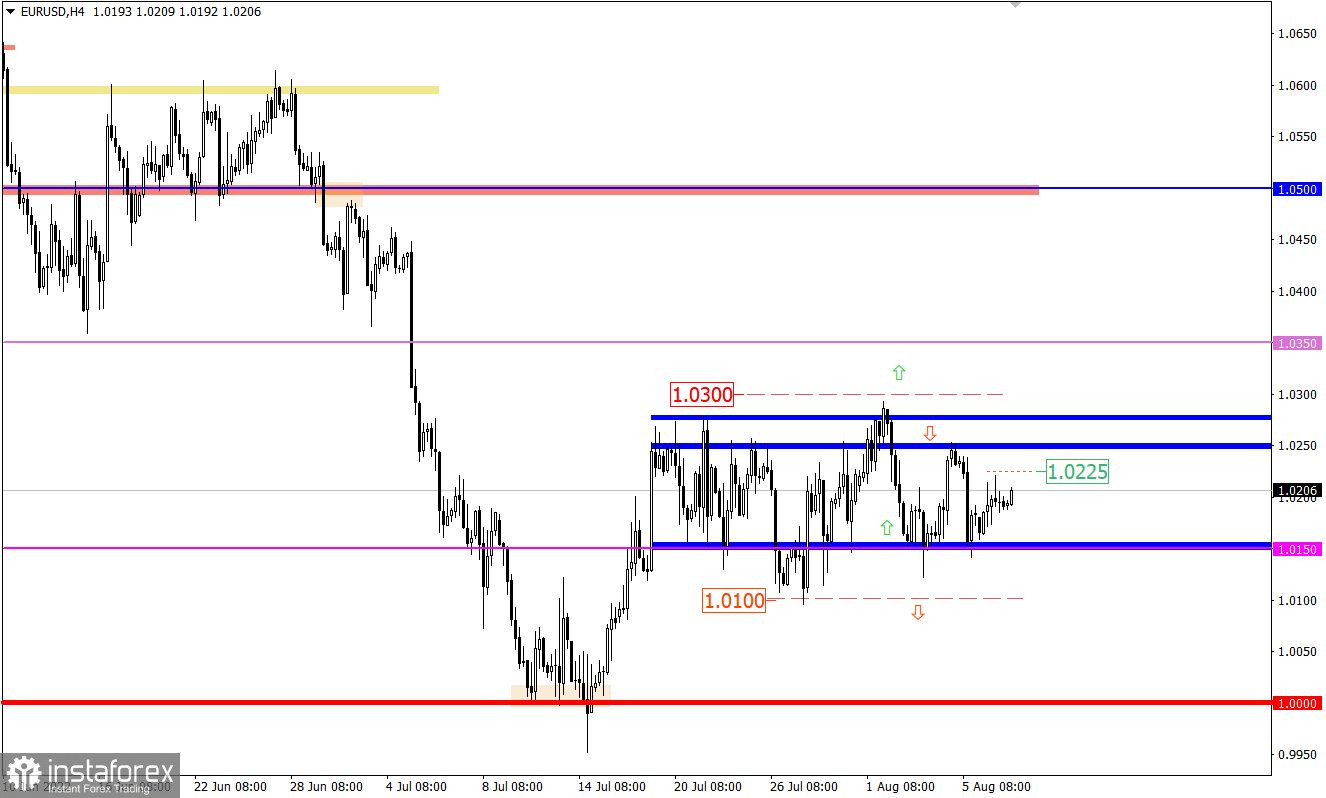
The EURUSD currency pair has been moving within the 1.0150/1.0270 side channel for the third week in a row, where another price rebound from its lower limit occurred last Friday. As a result, the euro strengthened by about 60, after which there was a stagnation along the value of 1.0200.
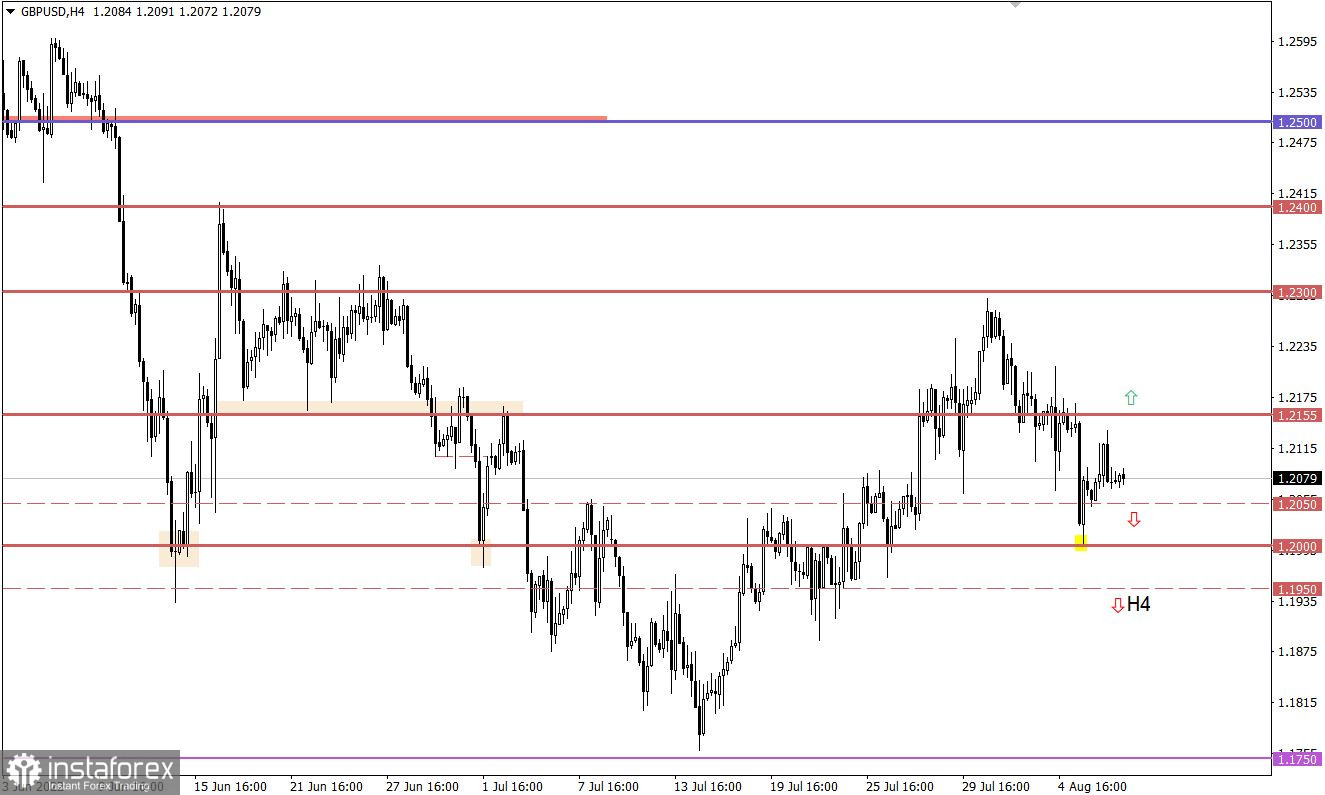
The GBPUSD currency pair is moving in the stage of a pullback from the psychological level of 1.2000. As a result, the pound strengthened in value by about 100 points, winning back Friday's decline.
Economic calendar for August 9
Tuesday is not much different from Monday in terms of the macroeconomic calendar. Important statistics in Europe, the United Kingdom, and the United States are not expected. Thus, traders have to keep track of the information flow and work based on the technical picture.
Trading plan for EUR/USD on August 9
It can be assumed that holding the price above 1.0225 will lead to the subsequent growth of the euro in the direction of 1.0250/1.0270. As a result, completing the next cycle of building a flat.
The main strategy, as before, is considered to be the method of breaking one of the control levels: 1.0300—when considering the upward development of the market; 1.0100—if market participants are focused on going towards the parity level.
It is worth noting that the signal must be confirmed in a four-hour period.
Trading plan for GBP/USD on August 9
In this situation, there is a short-term stagnation within the value of 1.2100. It can be assumed that the market will continue to be in the consolidation stage.
The main signal for action will appear after the price holds outside one of the variable values 1.2050/1.2155.
What is shown in the trading charts?
A candlestick chart view is graphical rectangles of white and black light, with sticks on top and bottom. When analyzing each candle in detail, you will see its characteristics of a relative period: the opening price, closing price, and maximum and minimum prices.
Horizontal levels are price coordinates, relative to which a stop or a price reversal may occur. These levels are called support and resistance in the market.
Circles and rectangles are highlighted examples where the price of the story unfolded. This color selection indicates horizontal lines that may put pressure on the quote in the future.
The up/down arrows are the reference points of the possible price direction in the future.
*La presente analisi del mercato ha un carattere esclusivamente informativo e non rappresenta una guida per l`effettuazione di una transazione.
Le recensioni analitiche di InstaSpot ti renderanno pienamente consapevole delle tendenze del mercato! Essendo un cliente InstaSpot, ti viene fornito un gran numero di servizi gratuiti per il trading efficiente.


