


Nella nostra squadra ci sono più di 7.000.000 trader! Ogni giorno ci impegniamo a far sì che il trading migliori. Conseguiamo grandi risultati e ci muoviamo in avanti.
Il riconoscimento da parte di milioni di trader in tutto il mondo rappresenta l'alta valutazione della nostra attività! Voi avete fatto la vostra scelta e noi faremo la nostra al fine di soddisfare le vostre aspettative!
Assieme siamo una grande squadra!
InstaSpot. Siamo orgogliosi di lavorare per voi!


Attore, campione del mondo di lotta libera e semplicemente un vero maciste russo! Persona venuta dal nulla. Persona che rispecchia i nostri obiettivi. Il segreto del successo di Taktarov consiste nel mirare continuamente al suo scopo.
Dischiudi anche tu tutti gli aspetti del tuo talento! Impara, prova, sbaglia, ma non fermarti!
InstaSpot - la storia delle tue vittorie inizia qui!

Details of the economic calendar from May 30
Monday was traditionally accompanied by a blank macroeconomic calendar. Important statistics in Europe, the UK, and the United States were not released. At the same time, the largest player (the United States) was absent from the market due to a day off.
Despite the absence of any statistics, the past day became important due to the strong information flow. The European Union has agreed on the sixth package of sanctions against Russia. The main topic was a partial embargo on Russian oil supplies. According to the head of the European Commission, Ursula von der Leyen, almost two-thirds of Russian oil exports to Europe fell under the ban. The comments also mention the deadline for adoption, which is within six months, that is, the embargo will be in full force by the end of the year.
In fact, the EU has once again hit its own economy, since in return for Russian oil they will have to replace the volume that has dropped out at a higher price. In the medium term, this may weaken the European currency.
Analysis of trading charts from May 30
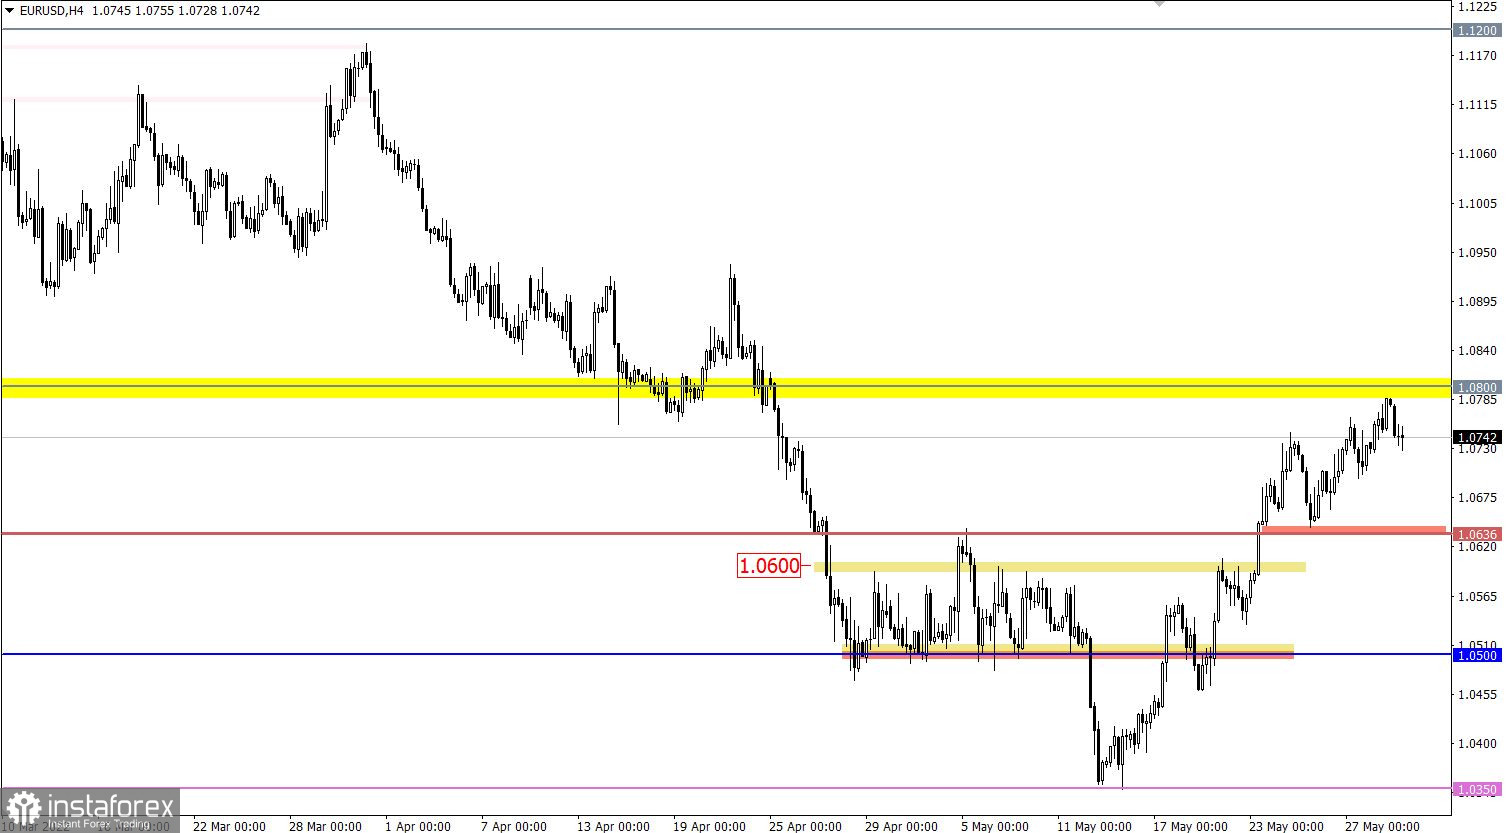
During the corrective movement, the EURUSD currency pair approached the resistance area of 1.0800/1.0850. This led to a reduction in the volume of long positions and, as a result, to a local pullback.
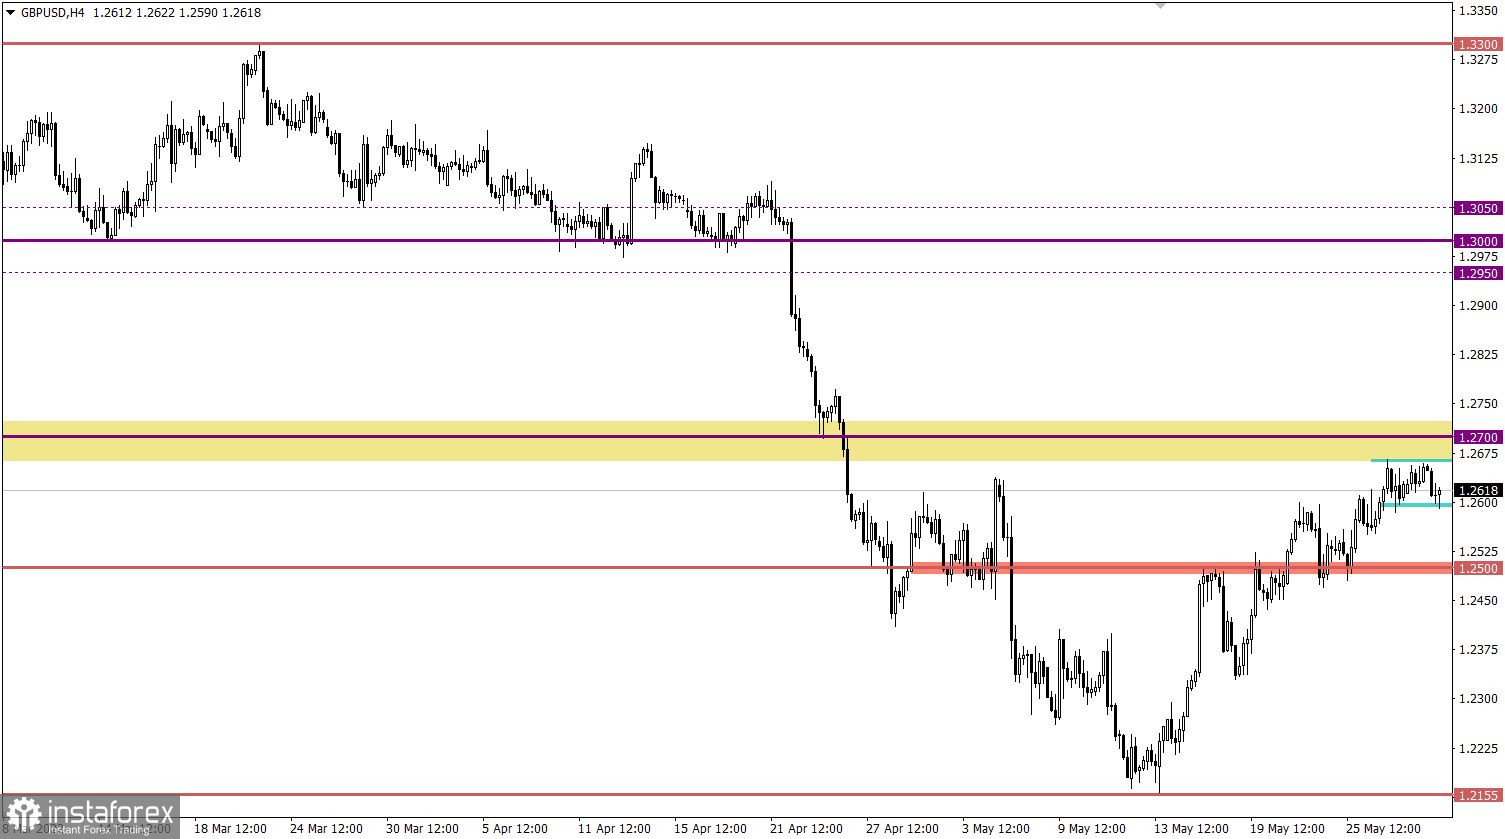
The GBPUSD currency pair formed a stagnation just below the 1.2670/1.2720 resistance area. This signals a slowdown in the upward cycle, where the volume of long positions has decreased.

Economic calendar for May 31
Today, traders are focused on the preliminary assessment of inflation in Europe. It is predicted that the consumer price index will continue to grow from 7.4% to 7.7%, which is a negative factor for the EU economy. Further inflation growth may stimulate the ECB to more aggressive tactics of tightening monetary policy. In simple words, the regulator may still move to an interest rate hike based on the growth of inflation. Thus, based on the logic of the ECB's further steps, this news may lead to an increase in the value of the euro in the medium term.
A short-term reaction to rising inflation could lead to a weakening of the euro.
Time targeting
EU Inflation - 09:00 UTC
Trading plan for EUR/USD on May 31
The area of resistance 1.0800/1.0850 is still putting pressure on buyers, which may lead to the completion of the corrective movement. If expectations are confirmed, the euro rate may return to the value of 1.0636.
An alternative scenario considers the prolongation of the correction. This signal will be relevant only if the price holds above 1.0850 in the daily period.
Trading plan for GBP/USD on May 31
In this situation, special attention is paid to the stage of stagnation within the amplitude of 1.2600/1.2700. This fluctuation may indicate the process of accumulation of trade forces, which will eventually lead to a local acceleration. Based on the assumption, the best trading tactic is the method of breaking through one or another stagnation border with confirmation in a four-hour period.
What is reflected in the trading charts?
A candlestick chart view is graphical rectangles of white and black light, with sticks on top and bottom. When analyzing each candle in detail, you will see its characteristics of a relative period: the opening price, closing price, and maximum and minimum prices.
Horizontal levels are price coordinates, relative to which a stop or a price reversal may occur. These levels are called support and resistance in the market.
Circles and rectangles are highlighted examples where the price of the story unfolded. This color selection indicates horizontal lines that may put pressure on the quote in the future.
The up/down arrows are the reference points of the possible price direction in the future.
*La presente analisi del mercato ha un carattere esclusivamente informativo e non rappresenta una guida per l`effettuazione di una transazione.
Le recensioni analitiche di InstaSpot ti renderanno pienamente consapevole delle tendenze del mercato! Essendo un cliente InstaSpot, ti viene fornito un gran numero di servizi gratuiti per il trading efficiente.


