


Nella nostra squadra ci sono più di 7.000.000 trader! Ogni giorno ci impegniamo a far sì che il trading migliori. Conseguiamo grandi risultati e ci muoviamo in avanti.
Il riconoscimento da parte di milioni di trader in tutto il mondo rappresenta l'alta valutazione della nostra attività! Voi avete fatto la vostra scelta e noi faremo la nostra al fine di soddisfare le vostre aspettative!
Assieme siamo una grande squadra!
InstaSpot. Siamo orgogliosi di lavorare per voi!


Attore, campione del mondo di lotta libera e semplicemente un vero maciste russo! Persona venuta dal nulla. Persona che rispecchia i nostri obiettivi. Il segreto del successo di Taktarov consiste nel mirare continuamente al suo scopo.
Dischiudi anche tu tutti gli aspetti del tuo talento! Impara, prova, sbaglia, ma non fermarti!
InstaSpot - la storia delle tue vittorie inizia qui!

Eurozone retail sales for February show a strong decline from 8.4% to 5.0% (y/y). If we consider the data month by month, then only 0.3% growth is recorded, while the forecast is 0.6%. The figures are bad and this is just the beginning as the data for March is expected to get even worse. The euro reacted to the statistics by weakening against the U.S. dollar.
During the American trading session, weekly data on jobless claims were released, where the overall figure showed an increase of 12,000. This is a negative factor for the U.S. labor market, which could negatively affect the U.S. dollar at the time of publication.
Statistics details:
Continuing claims for benefits increased from 1.506 million to 1.523 million.
Initial claims for benefits decreased slightly from 171,000 to 166,000.
Yesterday, the minutes of the ECB's March meeting were also published, where once again a signal of tightening monetary policy is visible. The decline of the markets is a matter of time.
The main theses of the ECB protocol:
- inflation will remain above the target in 2023.
- inflation can no longer be missed
- large-scale incentives are no longer needed
- the main QE (Asset Purchase Program) has already served its purpose
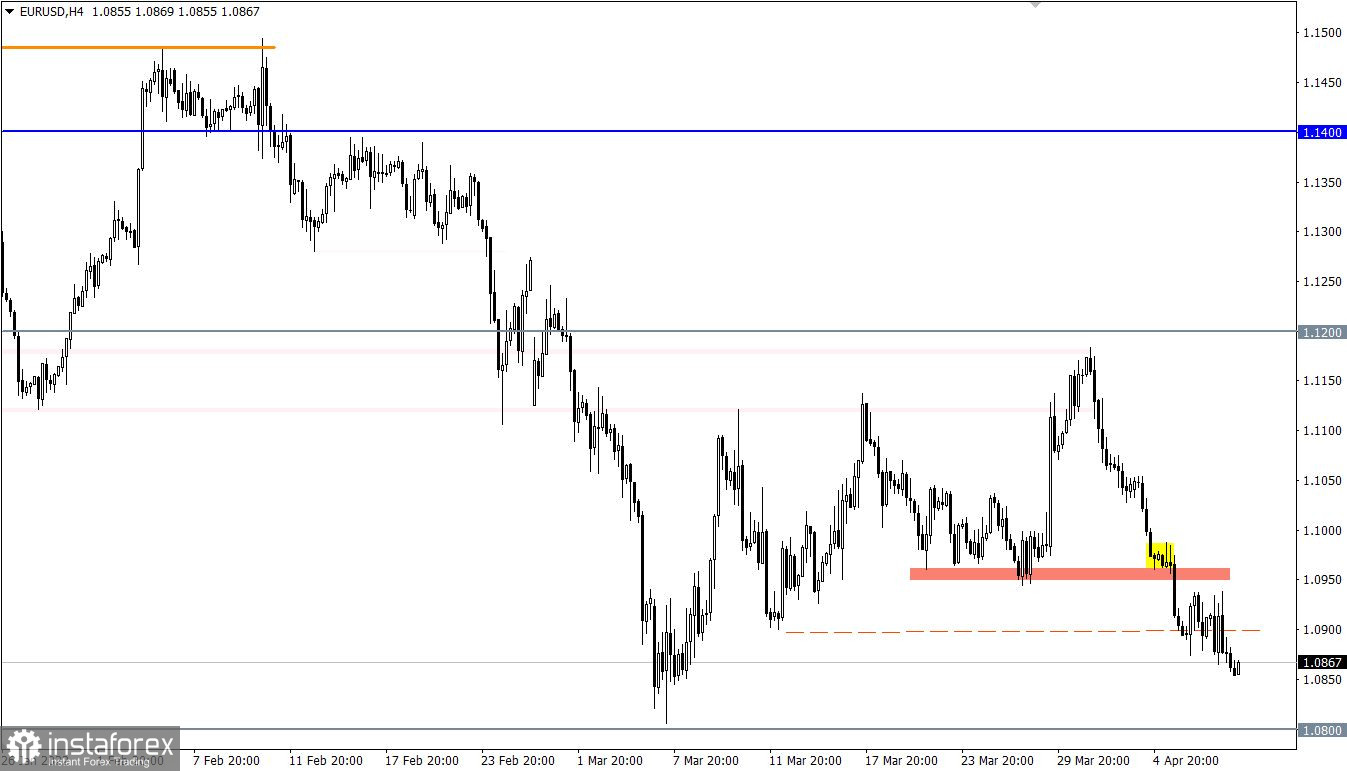
The EURUSD currency pair resumed its downward course after a short stop in the area of 1.0900. This led to the subsequent weakening of the euro, where 300 points were passed in just a week.
On the trading chart of the daily period, there is a recovery of dollar positions by more than 85% relative to the corrective move from the support level of 1.0800.
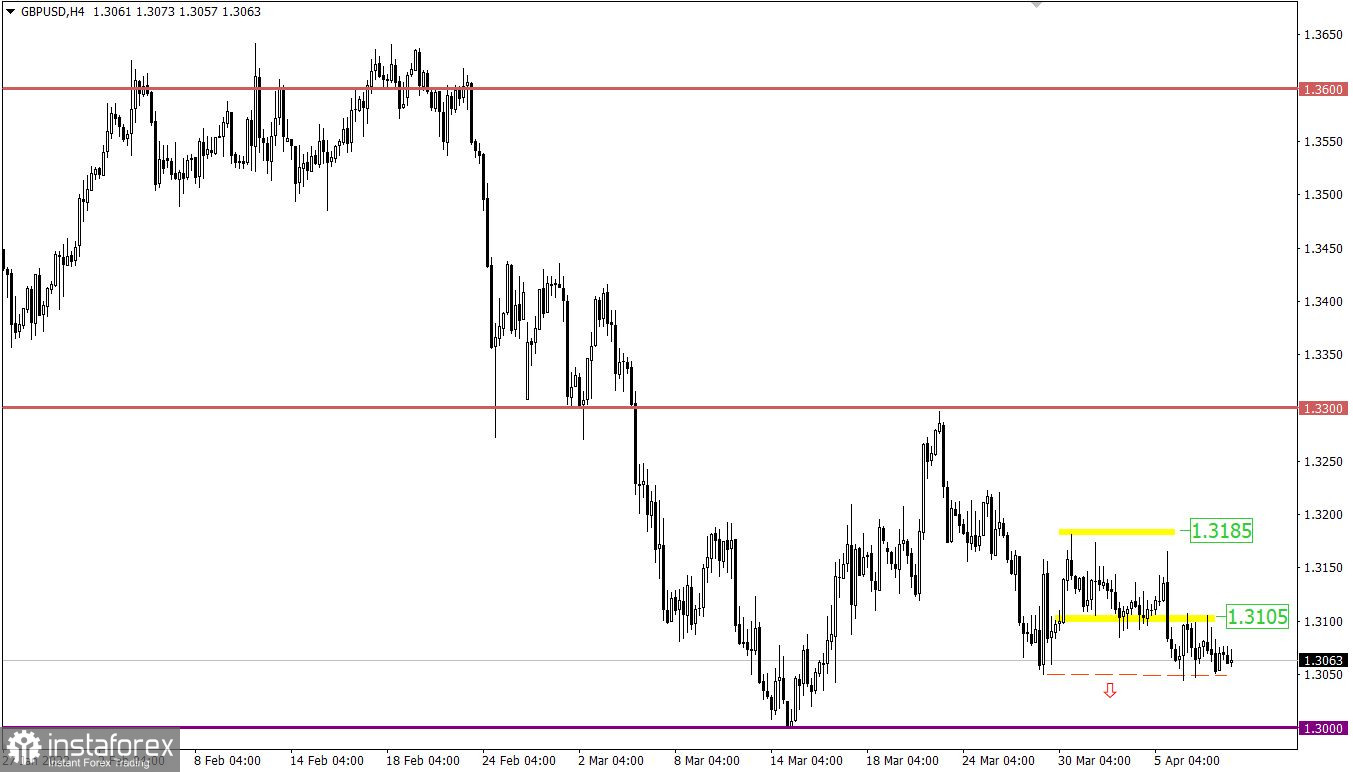
The GBPUSD currency pair, unlike EURUSD, has a restrained interest in short positions. This is indicated by a series of stagnations during the construction of a downward move. The price area of 1.3050/1.3060 serves as a variable foothold on the way of sellers, which only temporarily postponed the restoration of dollar positions.

Today, the macroeconomic calendar is empty, and the publication of important statistical data is not expected. Nevertheless, speculators will continue to monitor the information and news space.
In this situation, traders are focused on the subsequent weakening of the euro. The support level 1.0800 serves as the main pivot point. The signal of prolongation of the medium-term downward trend will come from the market only after holding the price below 1.1770 in the daily period. Until then, the risk of a price rebound from the support level of 1.0800 remains on the market.
Price stagnation with a high degree of probability will be won back by the market in the form of the accumulation of trading forces. This will lead to an acceleration in the market and, as a result, speculative transactions. A sell signal will be active at the moment the price keeps below 1.3050, which will lead to the weakening of the British currency at least to the support level of 1.3000. The next signal about the prolongation of the medium-term downward trend is expected after the price holds below 1.2950 in the daily period.
A candlestick chart view is graphical rectangles of white and black light, with sticks on top and bottom. When analyzing each candle in detail, you will see its characteristics of a relative period: the opening price, closing price, and maximum and minimum prices.
Horizontal levels are price coordinates, relative to which a stop or a price reversal may occur. These levels are called support and resistance in the market.
Circles and rectangles are highlighted examples where the price of the story unfolded. This color selection indicates horizontal lines that may put pressure on the quote in the future.
The up/down arrows are the reference points of the possible price direction in the future.
*La presente analisi del mercato ha un carattere esclusivamente informativo e non rappresenta una guida per l`effettuazione di una transazione.
Le recensioni analitiche di InstaSpot ti renderanno pienamente consapevole delle tendenze del mercato! Essendo un cliente InstaSpot, ti viene fornito un gran numero di servizi gratuiti per il trading efficiente.


