


La leggenda nel team InstaSpot!!
Legenda! Pensi che sia troppo patetico? Ma come dobbiamo chiamare un uomo, che è diventato il primo dell'Asia a vincere il campionato mondiale di scacchi a 18 anni e che è diventato il primo Gran Maestro indiano a 19? Fu l'inizio di un duro cammino verso il titolo di campione del mondo, l'uomo che divenne per sempre una parte della storia di scacchi. Un'altra leggenda nel team InstaSpot!


Il Borussia è una delle squadre di calcio più titolate in Germania, che ha ripetutamente dimostrato ai tifosi che lo spirito di competizione e leadership porta al successo. Fai trading nello stesso modo in cui lo fanno i professionisti dello sport - fiduciosamente e attivamente. Segui il Borussia FC e sii avanti con InstaSpot!

The main topic is considered to be Ukraine and the accompanying information and news noise. This led to strong speculation in the financial markets due to geopolitical risks.
The macroeconomic calendar had data on the United States, which were ignored by the market due to external information noise.
Statistics details:
As expected, the second estimate of the U.S. GDP coincided with the first (7%), which has already been taken into account in the quotes.
U.S. jobless claims data show a significant decline. So, initial claims decreased by 17,000, and continuing claims by 82,000.
Capital flight to the U.S. dollar accelerated in the market.
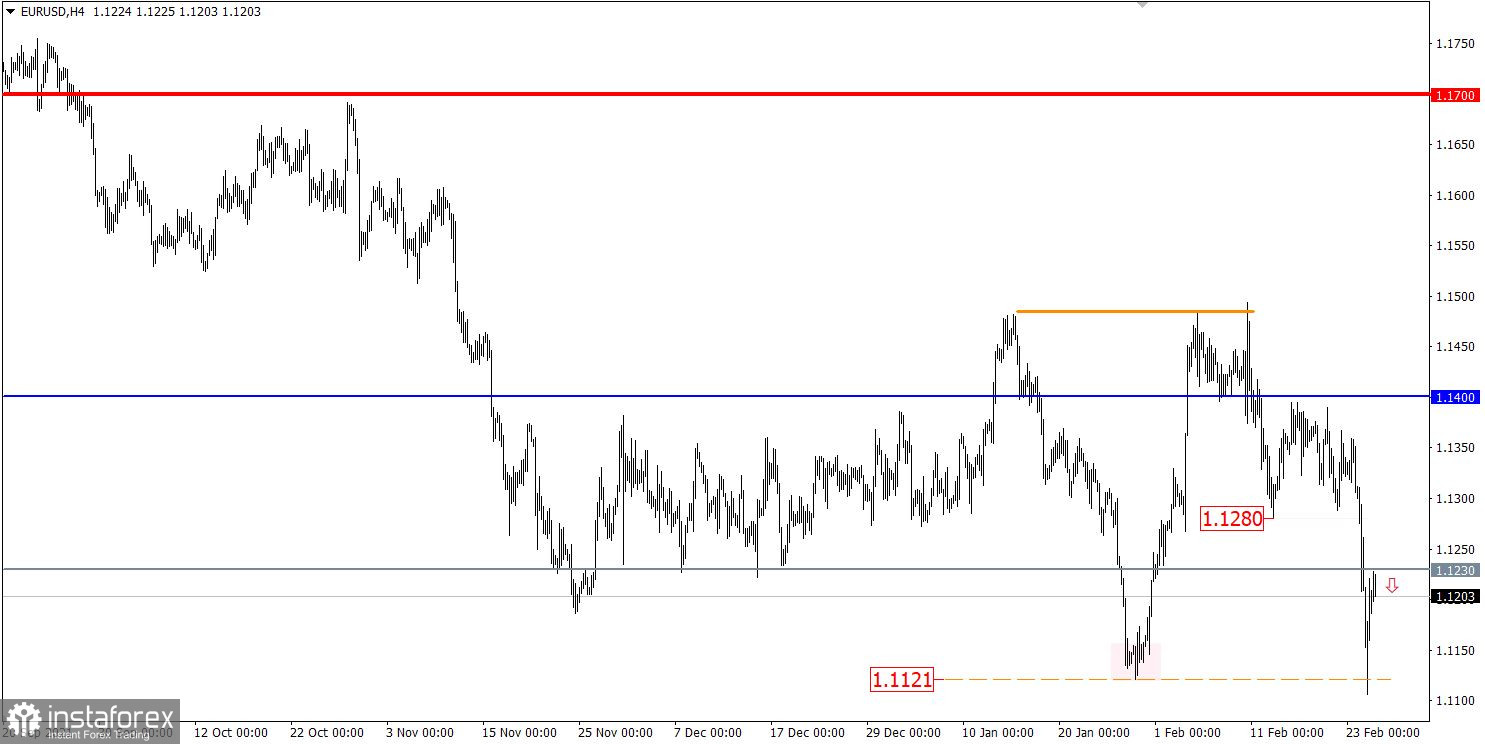
The EURUSD currency pair, during the intensive movement, locally updated the low of the downward trend at 1.1121, but the market participants failed to stay below it. As a result, the volume of short positions decreased and a technical correction took place. In this situation, there is a strong speculative interest that rules the market.
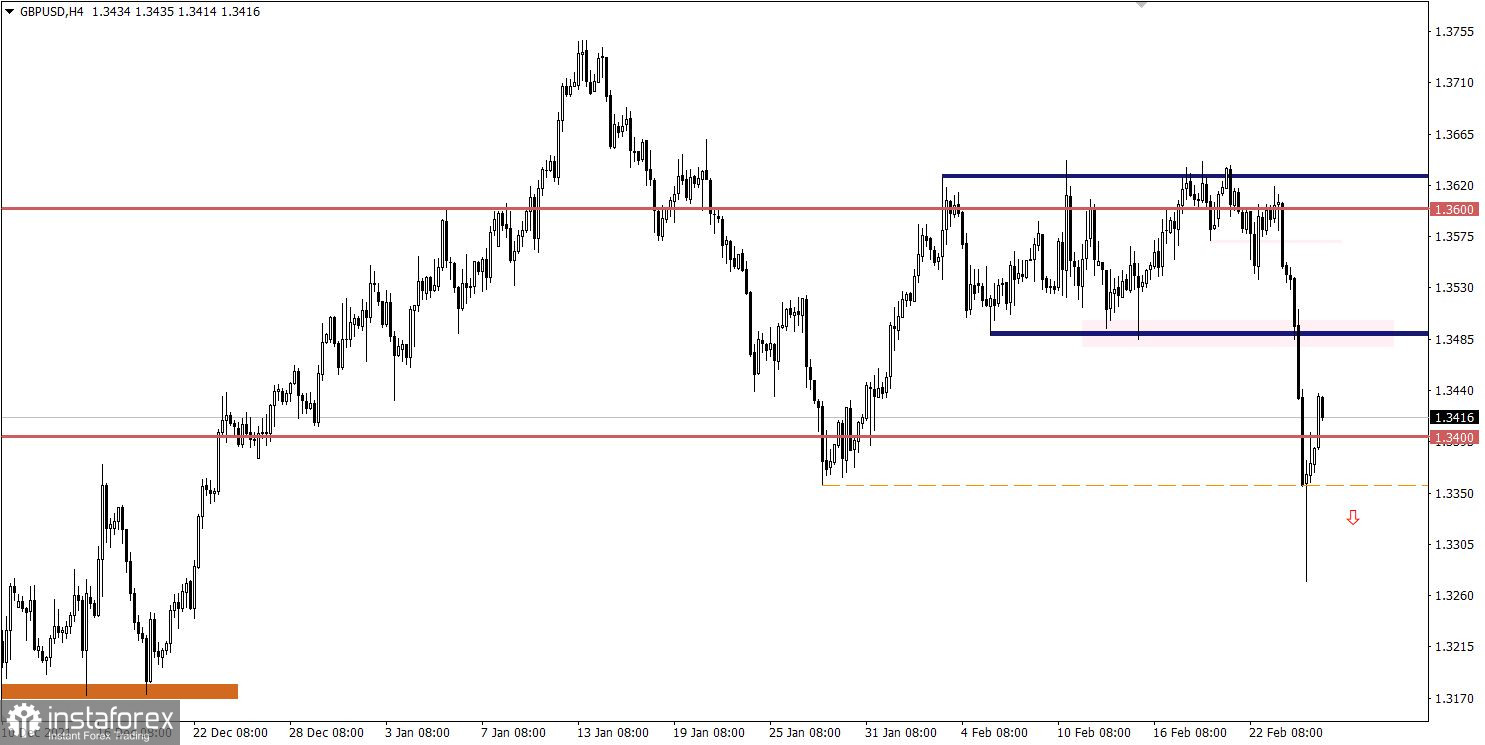
The GBPUSD currency pair, on the wave of strong speculation, locally lost more than 300 points in value over two trading days. This led to a renewal of the 2022 low and a strong overheating of short positions. As a result, a technical correction appeared on the market.
Today, information and news noise will continue to play a key role in the market, provoking speculators to take new steps. Thus, it is worth keeping track of the news flow and preparing for new bursts of activity.
As for the macroeconomic calendar, U.S. durable goods orders will be released. Their volume in January may increase by 0.8%. With a high degree of probability, statistical data will be ignored by traders.
Time targeting
U.S. Durable Goods Orders - 09:30 Universal time
The corrective move is still relevant in the market. The quote returned to the level of 1.1230, where there was a slight stagnation. The absence of holding the price above the value of 1.1250 in a four-hour period will lead to a new increase in the volume of short positions. This, in turn, will give sellers the opportunity to retest the 1.1121 foothold.
An alternative market development scenario will be considered by traders in case of a prolongation of the corrective move, where holding the price above 1.1250 in a four-hour period will open the way to 1.1280-1.1350.
In this situation, the correction is still taking place in the market, which led to a partial recovery of the British currency. The values of 1.3450 and 1.3480 can play as a possible resistance on the way of buyers. Thus, the downward move may eventually resume, supporting the general strengthening of dollar positions in the market. The largest increase in the volume of short positions is expected after holding the price below 1.3350 in the daily period.
A candlestick chart view is graphical rectangles of white and black light, with sticks on top and bottom. When analyzing each candle in detail, you will see its characteristics of a relative period: the opening price, closing price, and maximum and minimum prices.
Horizontal levels are price coordinates, relative to which a stop or a price reversal may occur. These levels are called support and resistance in the market.
Circles and rectangles are highlighted examples where the price of the story unfolded. This color selection indicates horizontal lines that may put pressure on the quote in the future.
The up/down arrows are the reference points of the possible price direction in the future.
*La presente analisi del mercato ha un carattere esclusivamente informativo e non rappresenta una guida per l`effettuazione di una transazione.
Le recensioni analitiche di InstaSpot ti renderanno pienamente consapevole delle tendenze del mercato! Essendo un cliente InstaSpot, ti viene fornito un gran numero di servizi gratuiti per il trading efficiente.


