


Nella nostra squadra ci sono più di 7.000.000 trader! Ogni giorno ci impegniamo a far sì che il trading migliori. Conseguiamo grandi risultati e ci muoviamo in avanti.
Il riconoscimento da parte di milioni di trader in tutto il mondo rappresenta l'alta valutazione della nostra attività! Voi avete fatto la vostra scelta e noi faremo la nostra al fine di soddisfare le vostre aspettative!
Assieme siamo una grande squadra!
InstaSpot. Siamo orgogliosi di lavorare per voi!


Attore, campione del mondo di lotta libera e semplicemente un vero maciste russo! Persona venuta dal nulla. Persona che rispecchia i nostri obiettivi. Il segreto del successo di Taktarov consiste nel mirare continuamente al suo scopo.
Dischiudi anche tu tutti gli aspetti del tuo talento! Impara, prova, sbaglia, ma non fermarti!
InstaSpot - la storia delle tue vittorie inizia qui!

Monday was traditionally accompanied by an empty macroeconomic calendar, but traders were not bored. The intrigue around the emergency meeting of the Federal Committee on Open Market Operations led to a decline in stock indices during February 10-11. The meeting was behind closed doors, limiting itself to a short press release without any comments or remarks. Based on the available information, the Fed focused on reducing the share of overdue loans, which hints at the inevitability of an increase in the refinancing rate.
It should be noted that there are more questions at the last meeting than answers. Therefore, the market, confused about what was happening, moved to stagnation.
Analysis of trading charts from February 14:
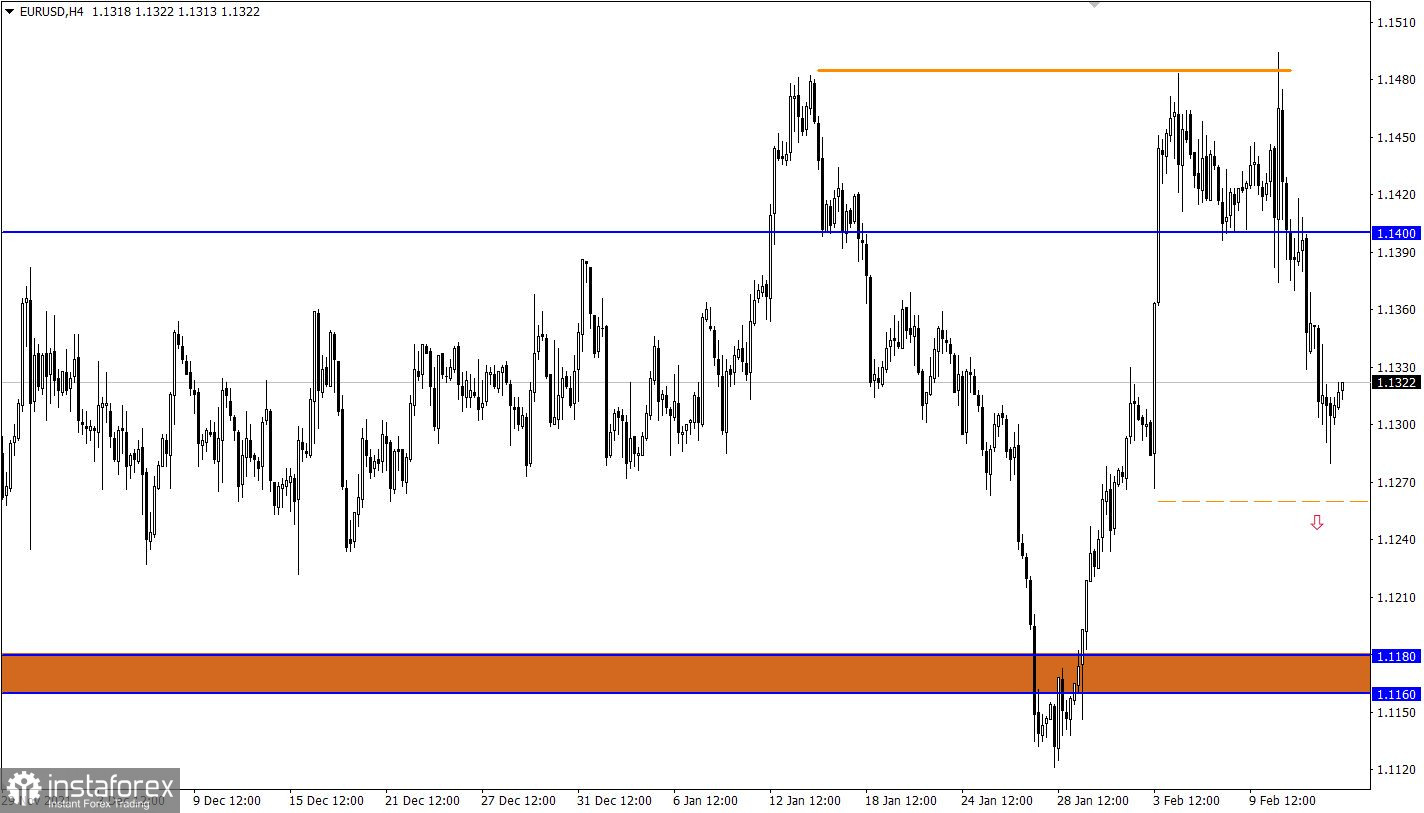
The EUR/USD pair lost more than 200 points in value in three trading days. This is a strong price change, which led to the recovery of dollar positions by more than 50% relative to the recent correction.
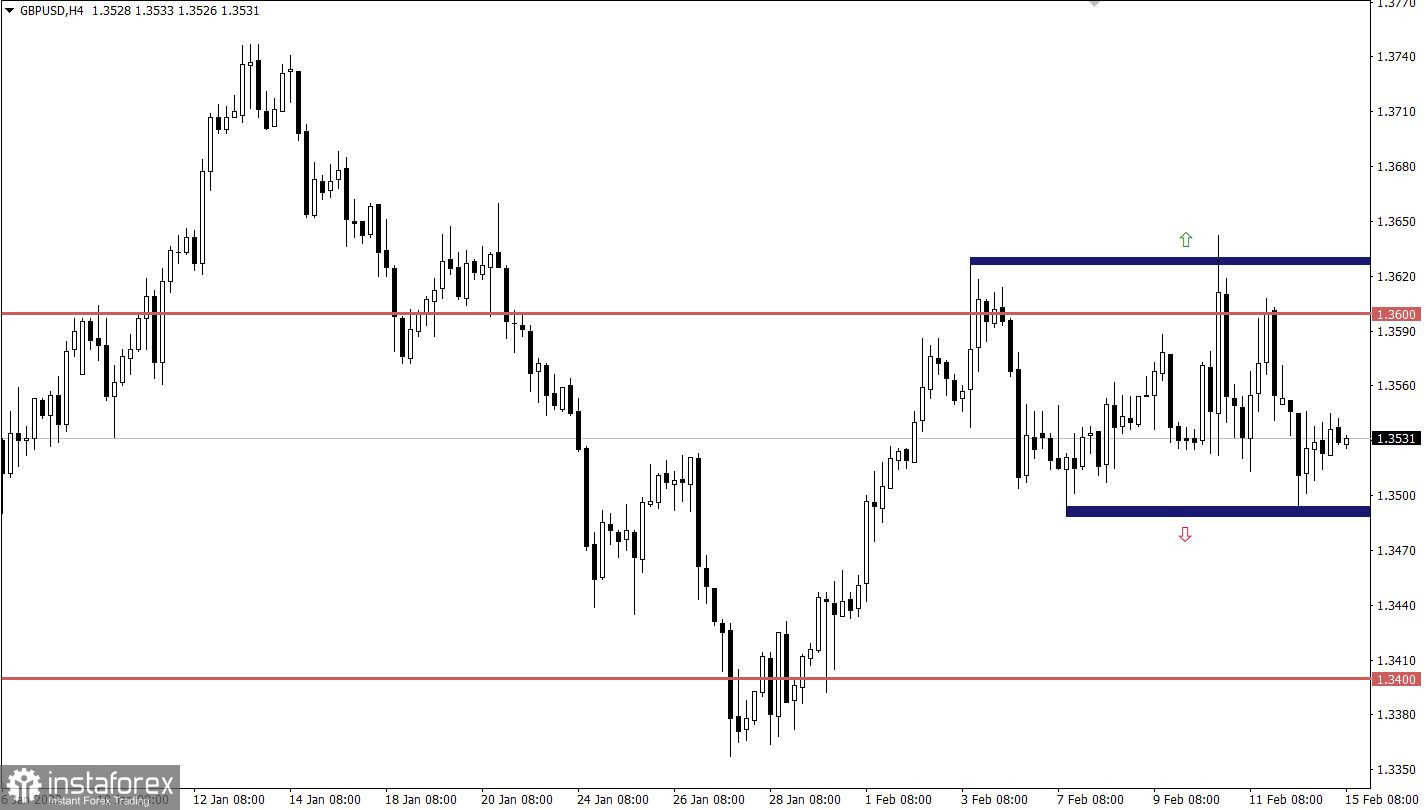
The GBP/USD pair failed to leave the long-playing side channel 1.3500/1.3600. The quote is still moving within its borders. This movement indicates the indecision of market participants for the next move. Unlike the pound, it is worth considering that the EUR/USD pair showed downward activity, ignoring the correlation between trading instruments.

February 15 economic calendar:
The UK labor market data was released today at 7:00 Universal time, where the unemployment rate remained at the same value of 4.1%. At the same time, the change in the number of applications for unemployment benefits in January fell by 31.9 thousand. Despite the positive data, they still coincided with market expectations, so there was no reaction.
As for Europe, the second estimate of GDP for the fourth quarter is expected to be published, which is likely to coincide with the first estimate. This means that the data for the EU should show an increase in the pace of the economy from 3.9% to 4.6%. The indicators are good but already considered in the quotes.
Next is the macroeconomic data in the US, where producer prices will be published. Their growth rates are expected to slow down from 9.7% to 9.1%.
Time targeting
EU GDP - 10:00 Universal time
US producer prices - 13:30 Universal time
Trading plan for EUR/USD on Feb 15:
The market stagnated since the quote is close to the local oversold status. This process may lead to a price pullback, which will lead to a regrouping of trading forces.
The subsequent increase in the volume of short positions will occur after holding the price below the level of 1.1260 in the H4 timeframe.
Trading plan for GBP/USD on Feb 15:
In this situation, price movement in a sideways range indicates the process of accumulation of trading forces, where trading within its limits is considered a less attractive tactic than trading on a breakdown.
The signal level is 1.3630 when considering buy positions, and 1.3480, in case of transition to the stage of recovery of downward interest.
What is reflected in the trading charts?
A candlestick chart view is graphical rectangles of white and black light, with sticks on top and bottom. When analyzing each candle in detail, you will see its characteristics of a relative period: the opening price, closing price, and maximum and minimum prices.
Horizontal levels are price coordinates, relative to which a stop or a price reversal may occur. These levels are called support and resistance in the market.
Circles and rectangles are highlighted examples where the price of the story unfolded. This color selection indicates horizontal lines that may put pressure on the quote in the future.
The up/down arrows are the reference points of the possible price direction in the future.
*La presente analisi del mercato ha un carattere esclusivamente informativo e non rappresenta una guida per l`effettuazione di una transazione.
Le recensioni analitiche di InstaSpot ti renderanno pienamente consapevole delle tendenze del mercato! Essendo un cliente InstaSpot, ti viene fornito un gran numero di servizi gratuiti per il trading efficiente.


