




La leggenda nel team InstaSpot!!
Legenda! Pensi che sia troppo patetico? Ma come dobbiamo chiamare un uomo, che è diventato il primo dell'Asia a vincere il campionato mondiale di scacchi a 18 anni e che è diventato il primo Gran Maestro indiano a 19? Fu l'inizio di un duro cammino verso il titolo di campione del mondo, l'uomo che divenne per sempre una parte della storia di scacchi. Un'altra leggenda nel team InstaSpot!





Il Borussia è una delle squadre di calcio più titolate in Germania, che ha ripetutamente dimostrato ai tifosi che lo spirito di competizione e leadership porta al successo. Fai trading nello stesso modo in cui lo fanno i professionisti dello sport - fiduciosamente e attivamente. Segui il Borussia FC e sii avanti con InstaSpot!

Eurozone's inflation continues to rise to 5%, which is an absolute record for the entire 25-year history of observations.
According to the statistics, inflation exceeds the 2% limit set by the European Central Bank. Nevertheless, this situation is temporary and is primarily due to a sharp increase in gas and electricity tariffs.
The publication of the US Department of Labor report, which was generally optimistic, was considered to be the key event. The unemployment rate in the country is declining at a much faster pace than experts predicted. The unemployment rate decreased from 4.2% to 3.9% with a forecast of 4.1%. This is a great signal about the recovery of the labor market.
The negative information from the report was on employment data, where 199 thousand new jobs were created in December against the forecast of 400 thousand. The discrepancy is quite strong, so speculators immediately reacted to this data, increasing the volume of short positions in the US dollar. It is worth considering that these were only local speculations, and overall, the report is not bad.
Analysis of trading charts from January 7:
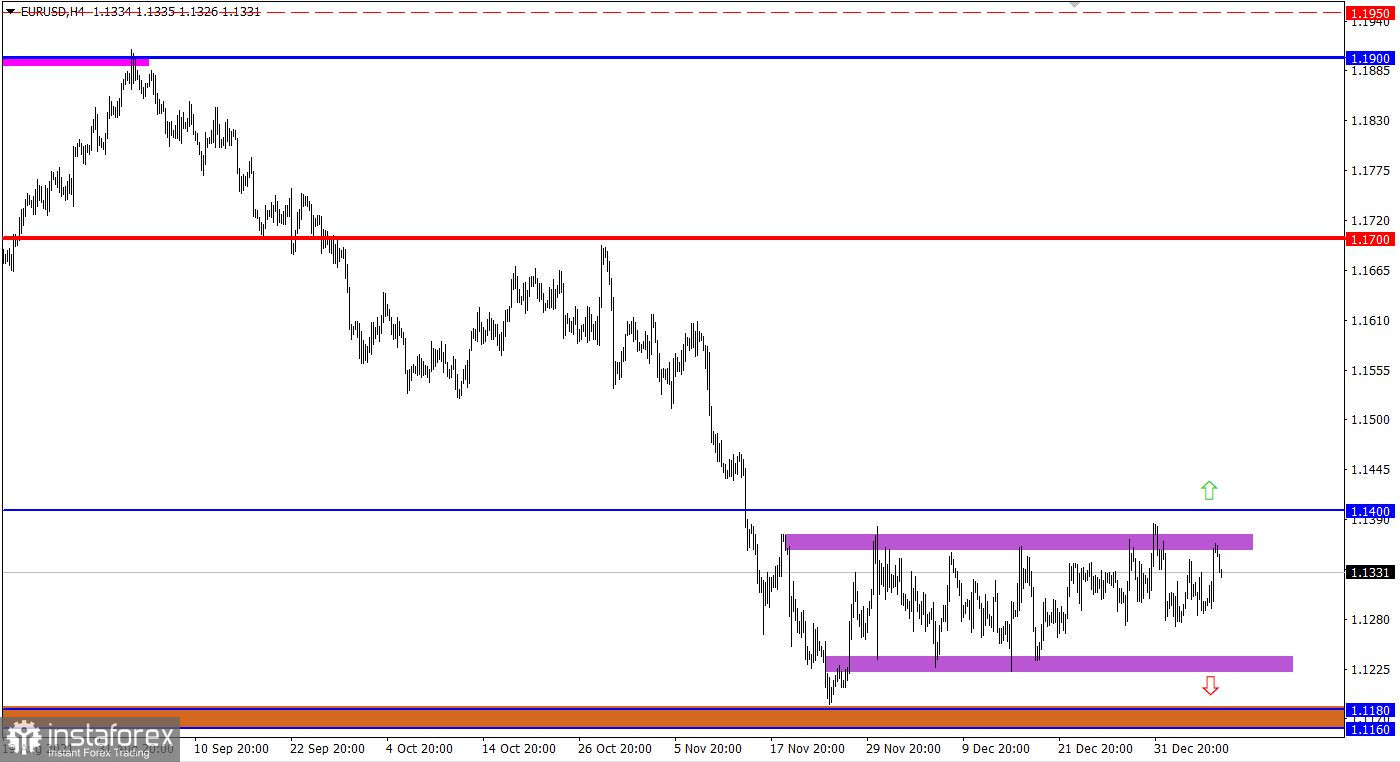
Speculations on the EUR/USD pair did not lead to a breakdown of the side channel 1.1225/1.1355. The quote still has a characteristic amplitude within the established framework, which indicates a high degree of uncertainty among market participants who cannot leave the flat borders for more than 6 weeks.
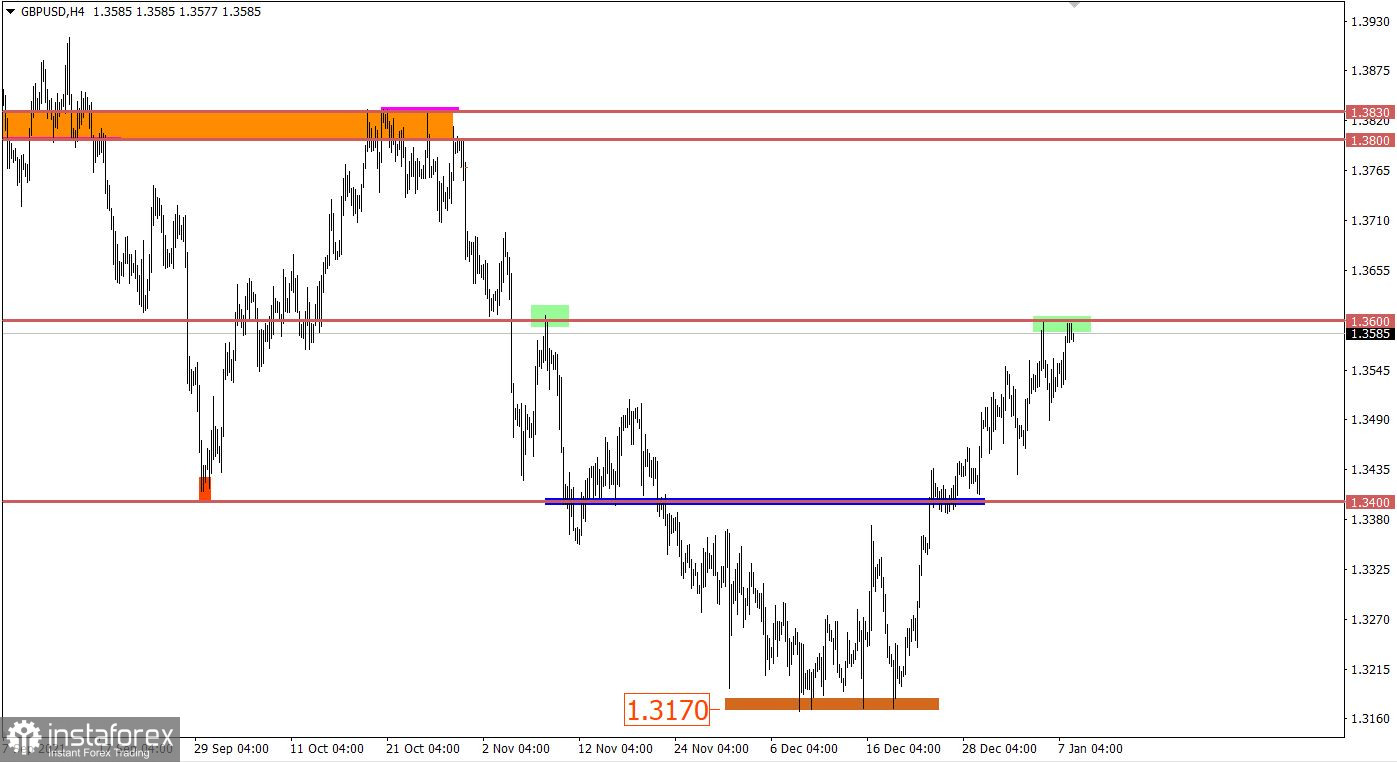
The GBP/USD pair is moving in the area of the resistance level of 1.3600, where earlier in history, there was a decrease in the volume of long positions. This led to a slowdown in the upward cycle and, as a result, stagnation.
January 10 economic calendar:
Eurozone's unemployment data will be released today, which is expected to fall from 7.3% to 7.2%.
This is a positive signal for the EU labor market.
Trading plan for EUR/USD on January 10:
In this situation, the tactics of trading on a rebound from the borders of the flat are still relevant in the market. Thus, it is not necessary to exclude a price reversal relative to the recent impulse. As for the breakdown tactics, the signal for action will appear in the market when the price is held beyond a certain control level of 1.1220 or 1.1400. This step will indicate the end of the flat and the subsequent direction of the quote.
Trading plan for GBP/USD on January 10:
A price rebound from the resistance level may result in a partial recovery of downward interest, where traders expect a gradual process of the pound's weakening. This scenario fits into the pattern of market cycles, where the downward trend still prevails in the market.
To consider the alternative scenario, the quote must hold above the level of 1.3600 in the daily period. In this case, the downward trend from June 2021 may be hit by a change in trading interests.
What is reflected in the trading charts?
A candlestick chart view is graphical rectangles of white and black light, with sticks on top and bottom. When analyzing each candle in detail, you will see its characteristics of a relative period: the opening price, closing price, and maximum and minimum prices.
Horizontal levels are price coordinates, relative to which a stop or a price reversal may occur. These levels are called support and resistance in the market.
Circles and rectangles are highlighted examples where the price of the story unfolded. This color selection indicates horizontal lines that may put pressure on the quote in the future.
The up/down arrows are the reference points of the possible price direction in the future.
*La presente analisi del mercato ha un carattere esclusivamente informativo e non rappresenta una guida per l`effettuazione di una transazione.
Le recensioni analitiche di InstaSpot ti renderanno pienamente consapevole delle tendenze del mercato! Essendo un cliente InstaSpot, ti viene fornito un gran numero di servizi gratuiti per il trading efficiente.


