


Tim kami memiliki lebih dari 7.000.000 trader!
Setiap harinya kami bekerja sama untuk meningkatkan trading. Kami memperoleh hasil tinggi dan terus bergerak maju.
Pengakuan dari jutaan trader diseluruh dunia merupakan apresiasi terbaik dari kerja kami! Anda membuat pilihan anda dan kami akan melakukan semua yang dibutuhkan untuk memenuhi ekspektasi anda!
We are a great team together!
InstaSpot. Bangga bekerja bersama anda!


Seorang Aktor, juara 6 turnamen UFC dan pahlawan sesungguhnya!
Pria yang berhasil. Pria yang berusaha keras.
Rahasia dibalik kesuksesan Taktarov adalah pergerakan konstan menuju target.
Tunjukkan seluruh sisi dari bakat anda!
Temukan, coba, gagal - namun jangan pernah berhenti!
InstaSpot. Cerita sukses anda dimulai disini!

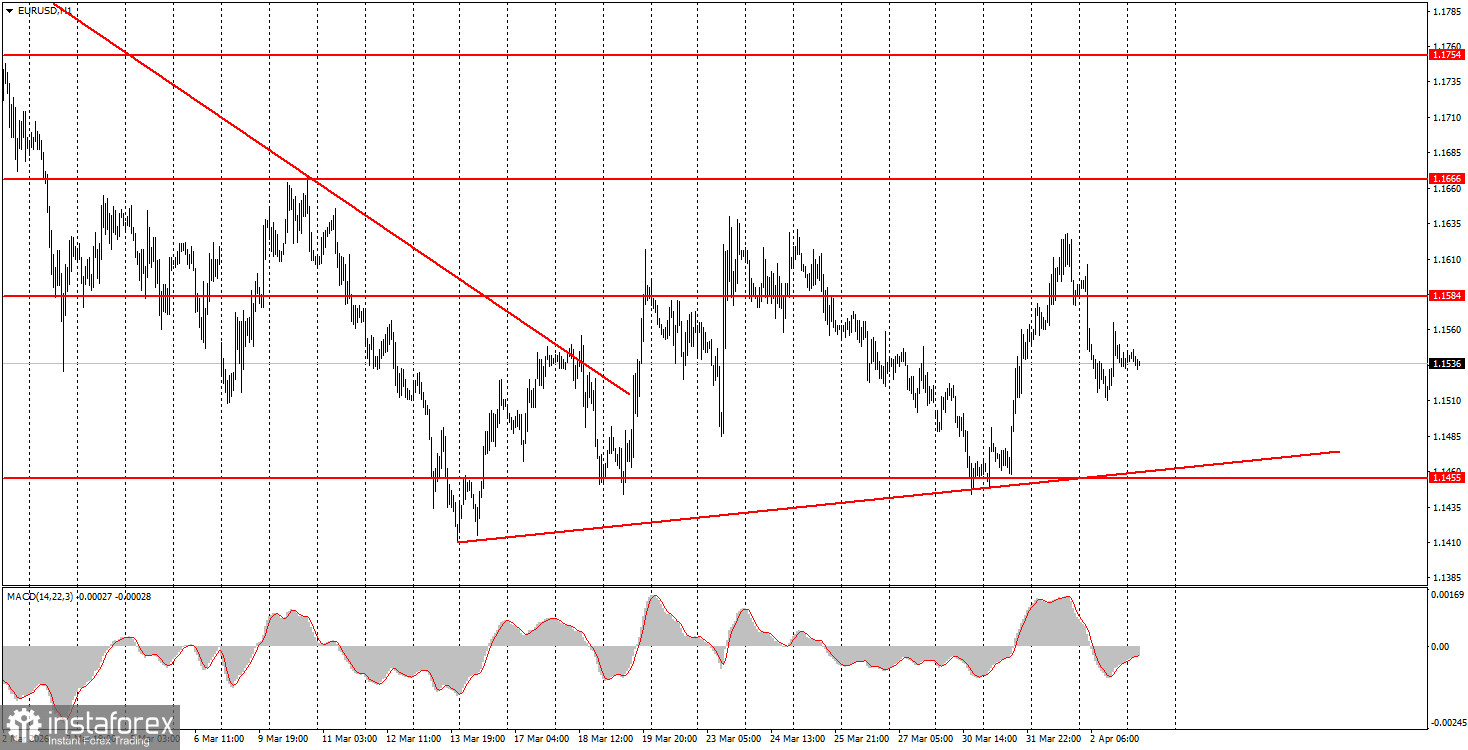
The EUR/USD currency pair traded lower on Thursday. The previous day, overnight, there was a speech by Donald Trump that caused a crash in both major currency pairs. The US President delivered another series of completely contradictory statements, but the markets were most influenced by phrases like "we will destroy Iran" and "we will deliver a devastating blow within the next two to three weeks." These words forced traders and investors to once again flee from anything associated with "risk." There was no macroeconomic background on Thursday, and the technical picture can currently be overlooked as the price moves solely under the influence of geopolitics. On the hourly timeframe, we adjusted the ascending trend line to keep it relevant, but similarly, one could redraw other trend lines an infinite number of times.
On the hourly timeframe, the ascending trendline has been breached, and we have once again not seen any significant upward trend. The new trend line is merely formal. The market continues to trade solely on geopolitics and emotions. Therefore, the "roller coaster" may continue for a long time. Trump continuously provokes both crashes and surges in the US dollar.
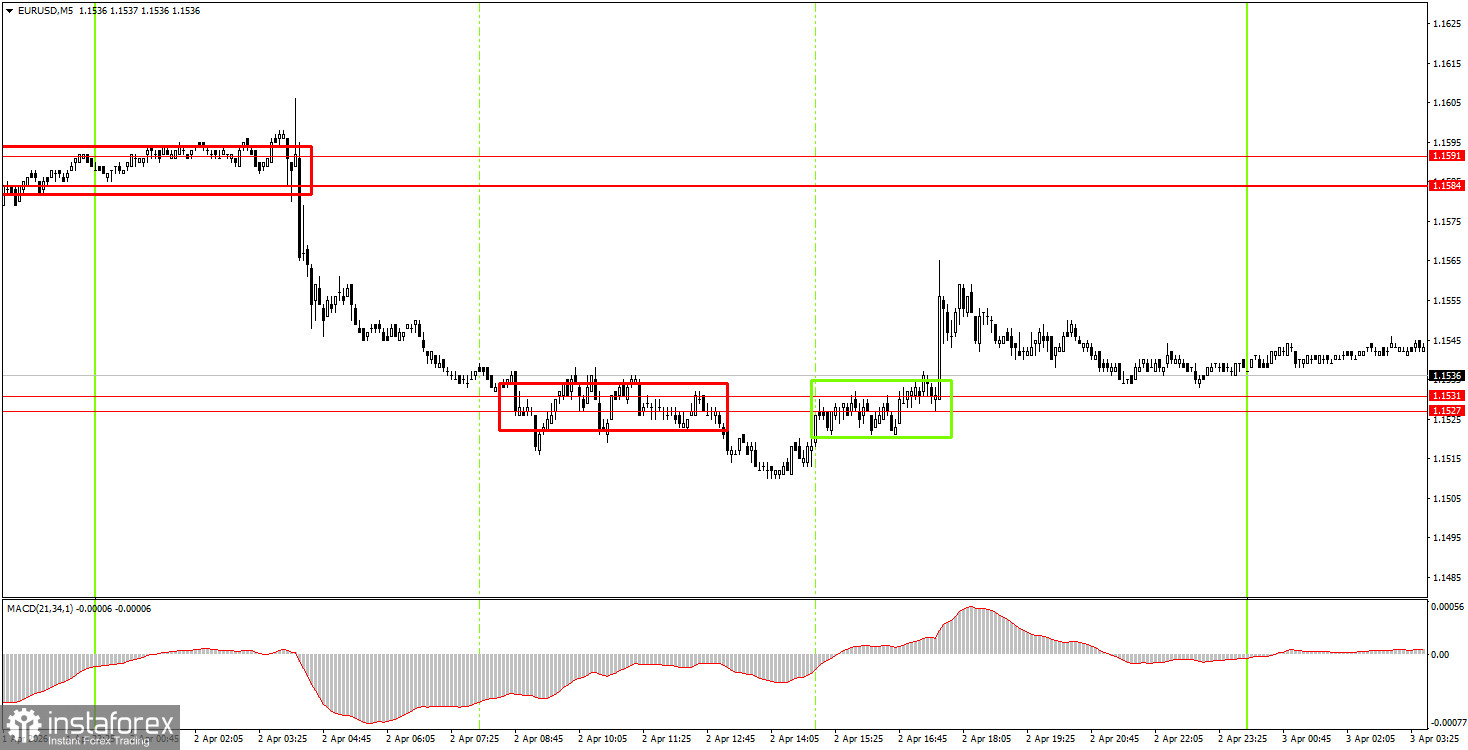
On Friday, beginning traders may consider short positions if the price consolidates below the 1.1527-1.1531 area, targeting 1.1455-1.1474. A price bounce from the 1.1527-1.1531 area will allow for long positions with a target of 1.1584-1.1591.
On the 5-minute timeframe, levels to consider include: 1.1267-1.1292, 1.1354-1.1363, 1.1413, 1.1455-1.1474, 1.1527-1.1531, 1.1584-1.1591, 1.1655-1.1666, 1.1745-1.1754, 1.1830-1.1837, and 1.1899-1.1908. On Friday, there are no important events scheduled in the European Union, while in the US, extremely important Non-Farm Payroll reports and unemployment figures will be published. We do not know whether the market will react to them (it ideally should), as for the past month and a half, it has largely ignored almost all macroeconomic and fundamental background.
Price levels of support and resistance are levels that serve as targets when opening buys or sells. Take Profit levels can be placed around them.
Red lines represent channels or trend lines that show the current trend and indicate the direction in which it is preferable to trade now.
The MACD indicator (14,22,3) – the histogram and the signal line – is a supporting indicator that can also be used as a source of signals.
Important speeches and reports (always included in the news calendar) can significantly affect the movement of the currency pair. Therefore, during their release, trading should be done with utmost caution, or traders should exit the market to avoid sharp price reversals against the previous movement.
Beginning traders in the forex market should remember that not every trade can be profitable. Developing a clear strategy and effective money management are the keys to long-term trading success.
*Analisis pasar yang diposting disini dimaksudkan untuk meningkatkan pengetahuan Anda namun tidak untuk memberi instruksi trading.
Tinjauan analitis InstaSpot akan membuat Anda menyadari sepenuhnya tren pasar! Sebagai klien InstaSpot, Anda dilengkapi dengan sejumlah besar layanan gratis untuk trading yang efisien.


