


La légende dans l'équipe InstaSpot!
La vraie légende! Vous pensez que c'est trop pathétique? Mais comment pouvez-vous appeler un homme qui, à 18 ans, est devenu le premier champion du monde d'échecs parmi les jeunes hommes d'Asie, et à dix-neuf ans – le premier grand maître de l'histoire de son pays? Ce fut le début de la voie du champion d'échecs –Viswanathan Anand – l'homme qui a inscrit son nom à jamais dans l'histoire des échecs du monde. Une autre légende dans l'équipe d'InstaSpot!


Le FC Borussia est l'un des clubs de football les plus titrés d'Allemagne, qui a prouvé à maintes reprises à ses fans que l'esprit de rivalité et de leadership mènera certainement au succès. Négociez de la même manière que les professionnels du sport mènent le jeu: en toute confiance et activement. Devenez un leader avec le FC Borussia et soyez en tête avec l'équipe InstaSpot!
Tuesday was not much different from Monday in terms of the macroeconomic calendar. Important statistics in Europe, the UK, and the United States were not published. The only thing that could serve as an incentive for speculators was the return of traders from the United States to the markets after the weekend.
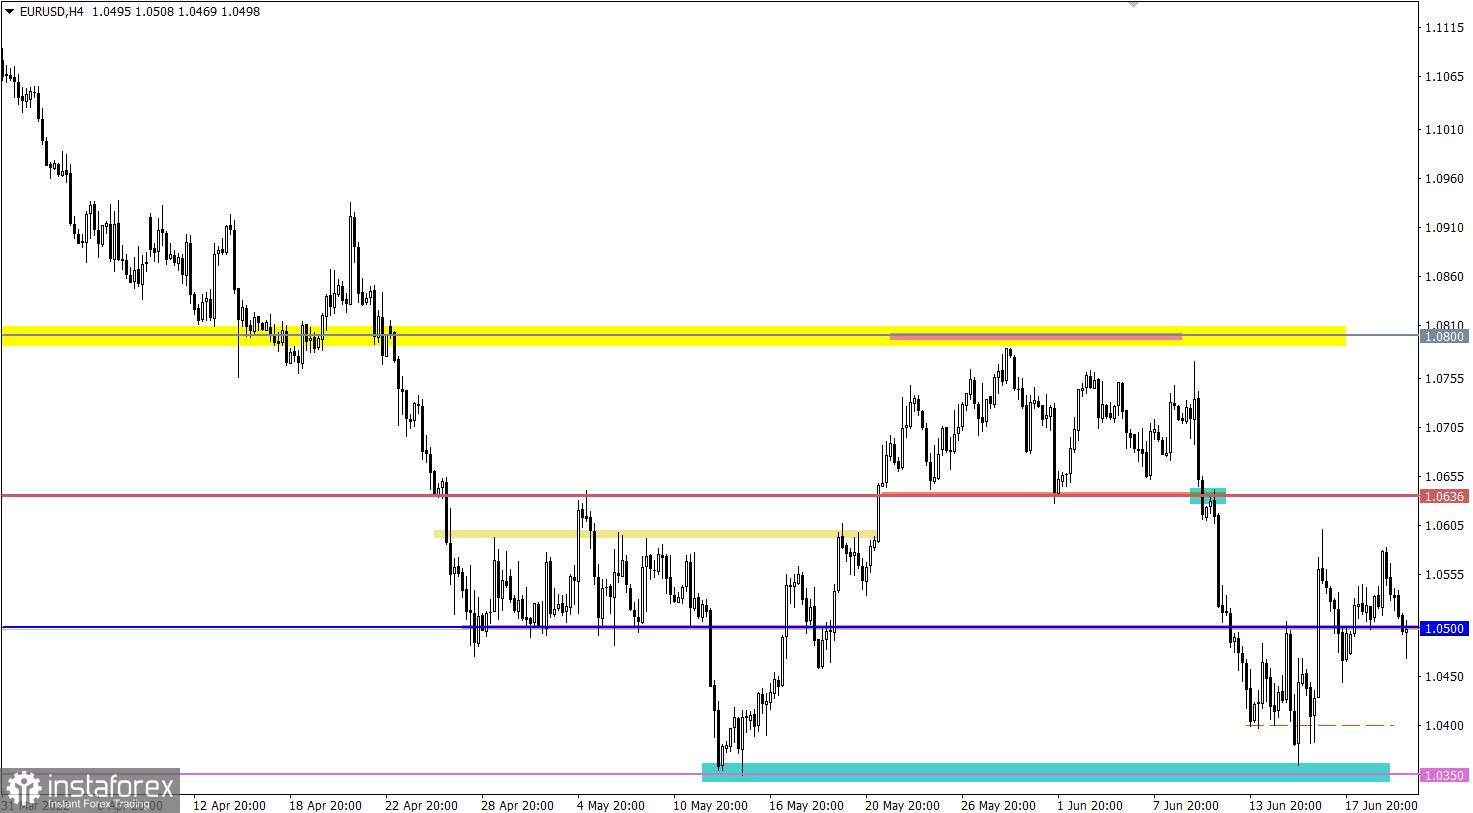
The EURUSD currency pair returned to the mirror level of 1.0500 after a short upward momentum. This amplitude movement indicates a high speculative interest among market participants.
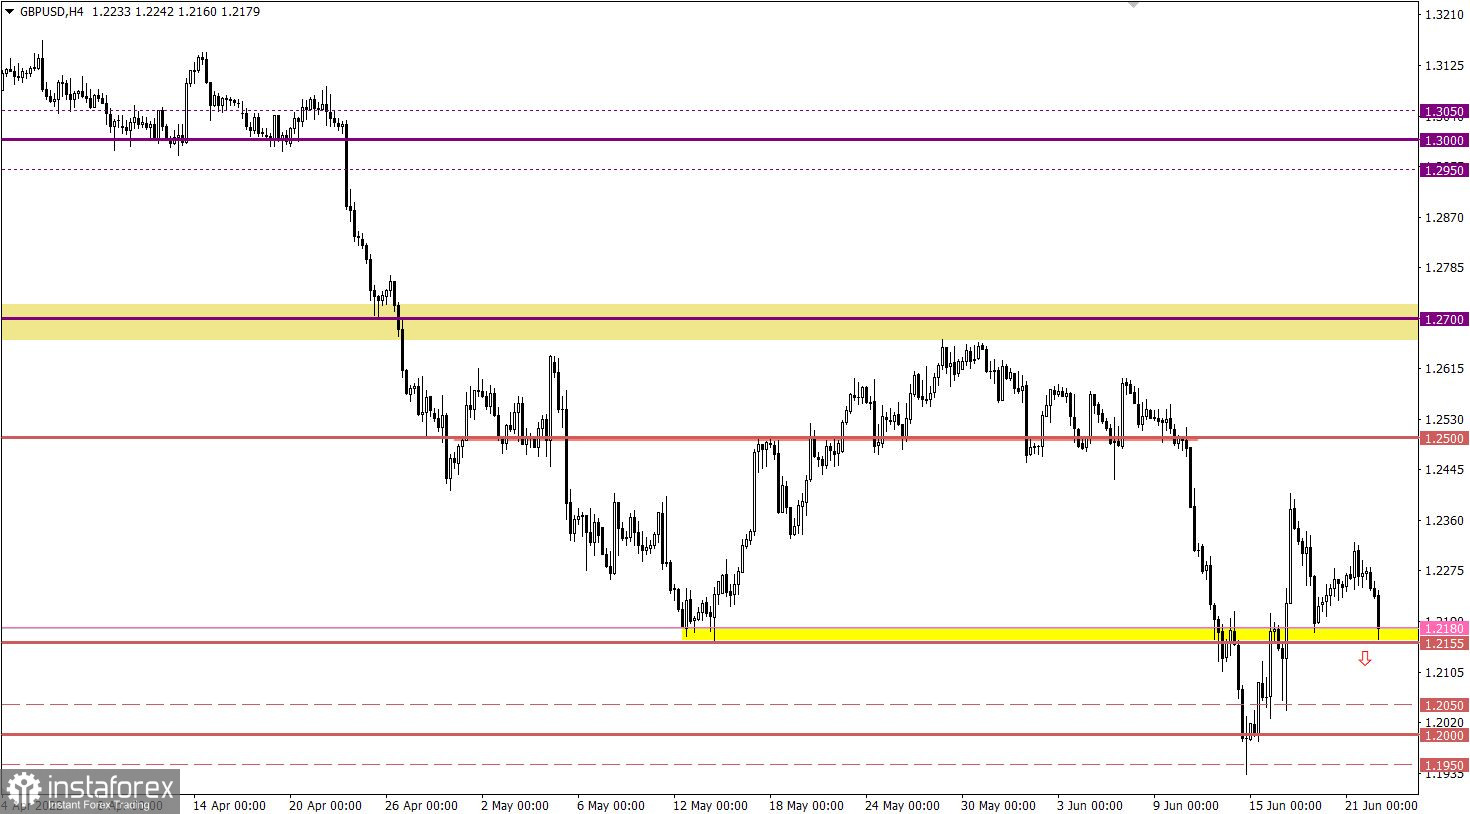
The GBPUSD currency pair rushed down following the euro, winning back the recent price rebound from the support area of 1.2155/1.2180. In fact, we have a signal to resume the downward cycle.
Today, data on inflation in the UK were published, where further growth was recorded. The growth rate of consumer prices accelerated from 9.0% to 9.1%, which once again proves the further actions of the Bank of England in terms of raising the interest rate.
A stable holding of the price below the level of 1.0500 may lead to a subsequent increase in the volume of short positions. In this case, there will be an increase in the downward move towards the values of 1.0470, 1.0400, 1.0350.
An alternative scenario considers a regular repetition of the past associated with the level of 1.0500. This can lead to stagnation followed by a price rebound.
In this situation, the main increase in the volume of short positions will occur after the price holds below the value of 1.2155 in a four-hour period. This move will lead to further weakening of the British currency towards the psychological level of 1.2000.
Otherwise, the current support area could slow down the downward cycle, eventually leading to a rebound.
A candlestick chart view is graphical rectangles of white and black light, with sticks on top and bottom. When analyzing each candle in detail, you will see its characteristics of a relative period: the opening price, closing price, and maximum and minimum prices.
Horizontal levels are price coordinates, relative to which a stop or a price reversal may occur. These levels are called support and resistance in the market.
Circles and rectangles are highlighted examples where the price of the story unfolded. This color selection indicates horizontal lines that may put pressure on the quote in the future.
The up/down arrows are the reference points of the possible price direction in the future.
*The market analysis posted here is meant to increase your awareness, but not to give instructions to make a trade.
InstaSpot analytical reviews will make you fully aware of market trends! Being an InstaSpot client, you are provided with a large number of free services for efficient trading.


