


La légende dans l'équipe InstaSpot!
La vraie légende! Vous pensez que c'est trop pathétique? Mais comment pouvez-vous appeler un homme qui, à 18 ans, est devenu le premier champion du monde d'échecs parmi les jeunes hommes d'Asie, et à dix-neuf ans – le premier grand maître de l'histoire de son pays? Ce fut le début de la voie du champion d'échecs –Viswanathan Anand – l'homme qui a inscrit son nom à jamais dans l'histoire des échecs du monde. Une autre légende dans l'équipe d'InstaSpot!


Le FC Borussia est l'un des clubs de football les plus titrés d'Allemagne, qui a prouvé à maintes reprises à ses fans que l'esprit de rivalité et de leadership mènera certainement au succès. Négociez de la même manière que les professionnels du sport mènent le jeu: en toute confiance et activement. Devenez un leader avec le FC Borussia et soyez en tête avec l'équipe InstaSpot!
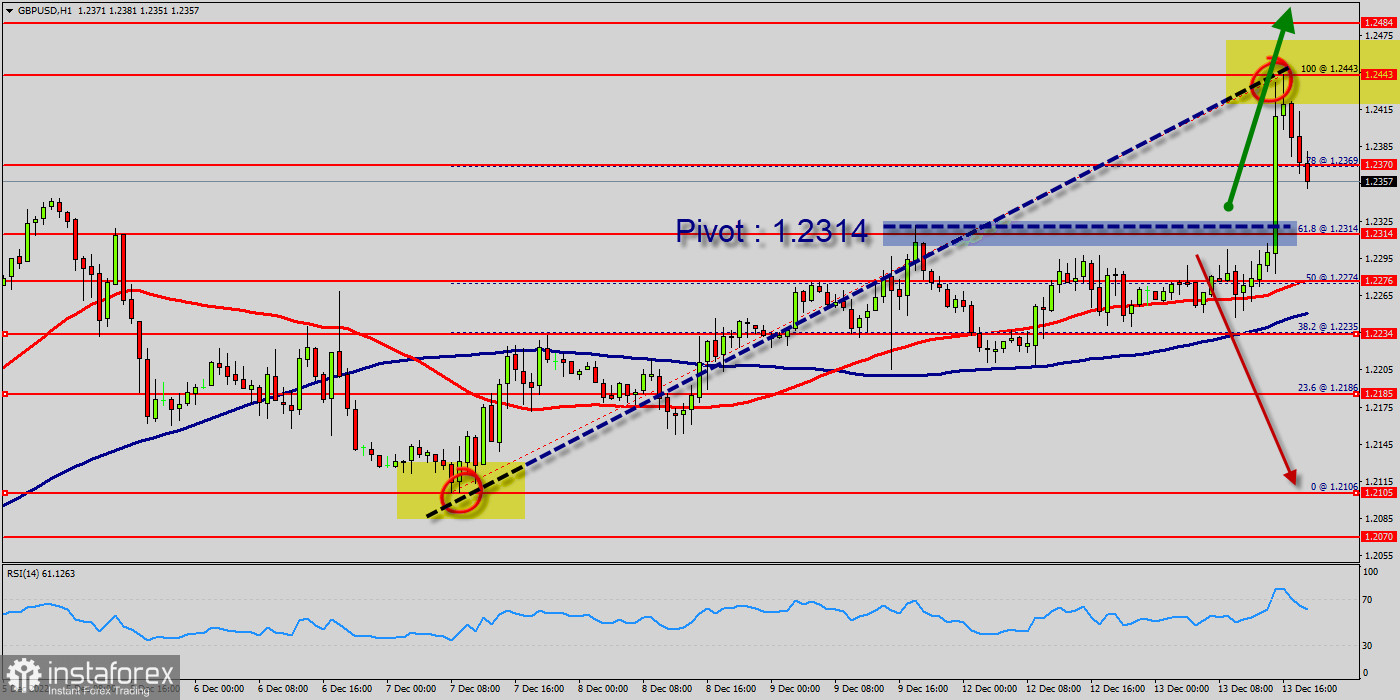
The GBP/USD pair is at highest against the dollar around the spot of 1.2363 - 1.2443 for three weeks. The GBP/USD pair is inside in upward channel. This week, the GBP/USD pair decreased within an up channel, for that the trend its new highest 1.2443. But the trend rebounded from the resistance 1.2443 to close at 1.2363 on the hourly chart.
Consequently, the first support is set at the level of 1.2363. Hence, the market is likely to show signs of a bullish trend around the area of 1.2363 and 1.2314.
The GBP/USD pair reverses from 1.2443 and drops to multi-day lows near 1.2363 - this price formed a bottom this morning in the hourly chart.
Right now, the GBP/USD pair dropped further and bottomed at 1.2363. It then trimmed losses, rising to from 1.2363. The move lower took place amid a stronger US dollar across the board. Probably, the main scenario is continued decline towards 1.2314 (sentiment level).
The level of 1.2314 coincides with the golden ratio (61.8% of Fibonacci retracement) which is acting as major support today.
Another thought: the Relative Strength Index (RSI) is considered overbought because it is above 55. The GBP/USD pair price could be awaiting a major upswing if the digital savings manages to slice above a fatal line of the first resistance that sets at the price of 1.2443 (Horizontal red line).
The prevailing chart pattern suggests that if the leading the trend could be expecting to rebound from the levels of 1.2314 and 1.2443.
Moreover, if the GBP/USD pair fails to break through the support prices of 1.2314 today, the market will rise further to 1.2443 so as to try to break it again.
The GBP/USD pair is one the best overall investment for in coming weeks. However, if you want to try to improve the growth of Pound, thus it seems great to buy above the last bearish waves of 1.2314.
The pair will move upwards continuing the development of the bullish trend to the level 1.2314 - golden ratio 61.8%.
Buy orders are recommended above the major's support rates of (1.2314) with the first target at the level of 1.2443.
Furthermore, if the trend is able to breakout through the first resistance level of 1.2369 (1.2369 - to test the 78% of Fibonacci retracement levels).
We should see the pair climbing towards the next target of 1.2443. It might be noted that the level of 1.2443 is a good place to take profit because it will form a new double top in coming hours.
Overall, we still prefer the bullish scenario. Consequently, there is a possibility that the GBP/USD pair will move downside. The structure of a rise does not look corrective. In order to indicate a bullish opportunity above 1.2314, buy above 1.2314 with the first target at 1.2443. Besides, the weekly resistance 2 is seen at the level of 1.2484.
The market will climb further to 1.2484. This would suggest a bullish market because the RSI indicator is still in a positive area and does not show any trend-reversal signs.
The pair is expected to rise higher towards at least 1.2503 in order to test the third resistance (1.2503) in coming hours.
However, traders should watch for any sign of a bullish rejection that occurs around 1.2314-1.2300.
*The market analysis posted here is meant to increase your awareness, but not to give instructions to make a trade.
InstaSpot analytical reviews will make you fully aware of market trends! Being an InstaSpot client, you are provided with a large number of free services for efficient trading.


