


我们的团队有超过700万的操盘手!
我们每天都在一起努力改善交易。我们得到了很高的成绩,并继续前进。
世界各地数以百万计的操盘手的认可是我们工作的最大赞赏! 您做出了您的选择,我们将尽一切努力来满足您的期望!
我们是一个共同的伟大团队!
InstaSpot. 自豪地为您工作!


Selling pressure in the US dollar index pushed it below the important resistance levels opening the way for a move towards 95-94. The trend is clearly bearish on all time frames.
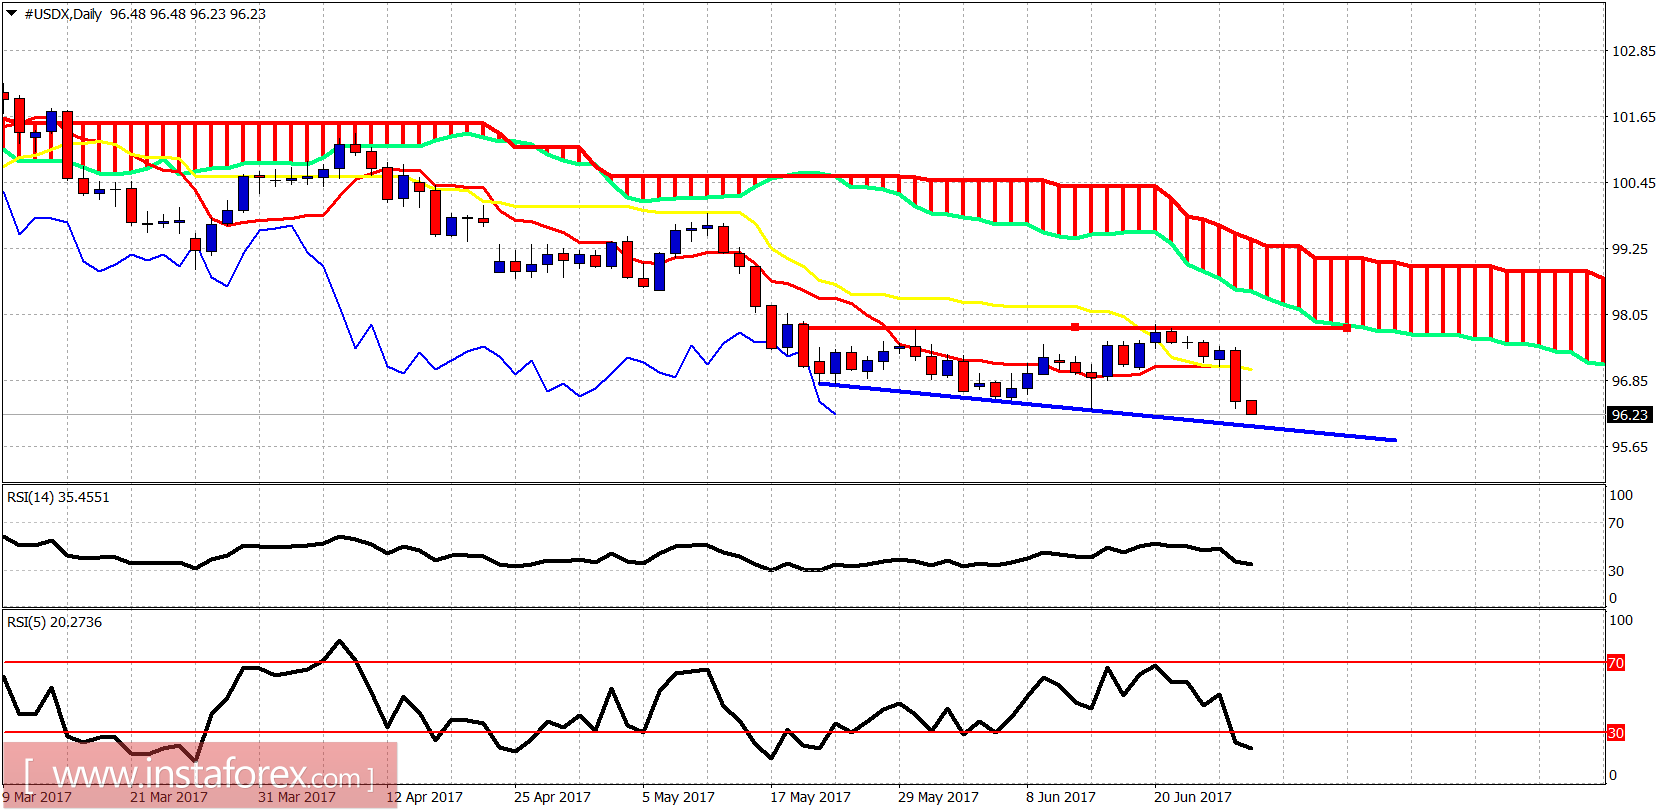
Blue line - support
Price has broken below the Tenkan- and Kijun-Sen on the daily chart. The index has been forming something like a megaphone for the last few weeks and this provides a support at 95.70. However, I believe that the move that started just below 98 last week is not going to stop there but much lower. The consolidation of the last few weeks is being broken downwards.
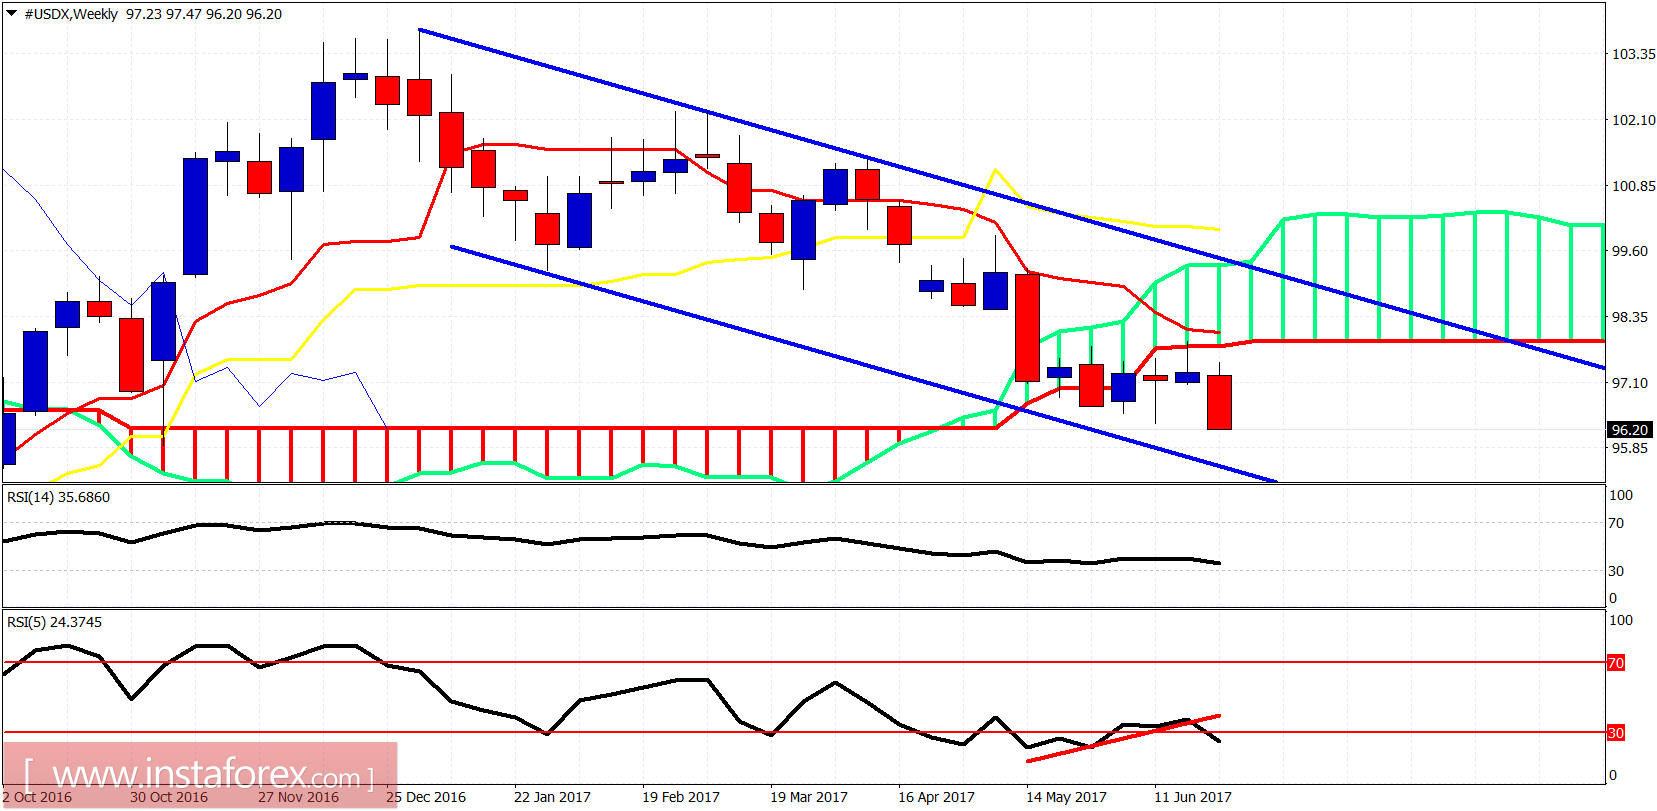
The rejection from the Ichimoku cloud was a stronger bearish signal than the bullish divergence by the RSI(5). The trend remains bearish as a new weekly low is made. We have to wait and see if the RSI indicators provide a new low or a new divergence.
*这里的市场分析是为了增加您对市场的了解,而不是给出交易的指示。
InstaSpot分析评论将让您充分了解市场趋势! 作为InstaSpot的客户,您将获得大量的免费服务以实现有效的交易。


