




我们的团队有超过700万的操盘手!
我们每天都在一起努力改善交易。我们得到了很高的成绩,并继续前进。
世界各地数以百万计的操盘手的认可是我们工作的最大赞赏! 您做出了您的选择,我们将尽一切努力来满足您的期望!
我们是一个共同的伟大团队!
InstaSpot. 自豪地为您工作!



Bitcoin ended a local flat and broke out into wider territory. However, there is still no confidence that the leading cryptocurrency will continue to rise. The current rise on the daily timeframe still looks like an unfounded pump or manipulation by large players aimed at pushing as many traders as possible into long positions, only to then crash the price. Essentially, price has left the daily sideways channel, but this breakout may still be an abnormal, deep deviation. Therefore, we still consider the probability of a new fall to the lower boundary of the sideways channel higher than that of further growth.
The new week began with another, albeit restrained, Bitcoin uptick in response to events in the Middle East. Overnight Yemen's President Rashad al-Alimi announced a military operation against the Houthis, who control much of the country, including Sanaa. Al-Alimi said the operation's goal is to restore control over all Yemeni territory. It is not hard to imagine that a next step in the conflict could be attempts to choke the Bab el-Mandeb strait — a tool the pro-Iranian Houthis might use as leverage. Oil prices remain relatively stable so far, but markets have begun to react nervously. The US dollar already posted another leg up overnight despite Friday's poor US labor data. Capital flight from the Middle East could resume soon, which would weigh on Bitcoin and other risk assets.
We continue to emphasize that more bearish factors have accumulated for Bitcoin recently than bullish ones. The technical picture points to a corrective structure on the weekly TF and a persistent flat on the daily TF. Thus, we see no grounds for a sustained Bitcoin rally based on current information.
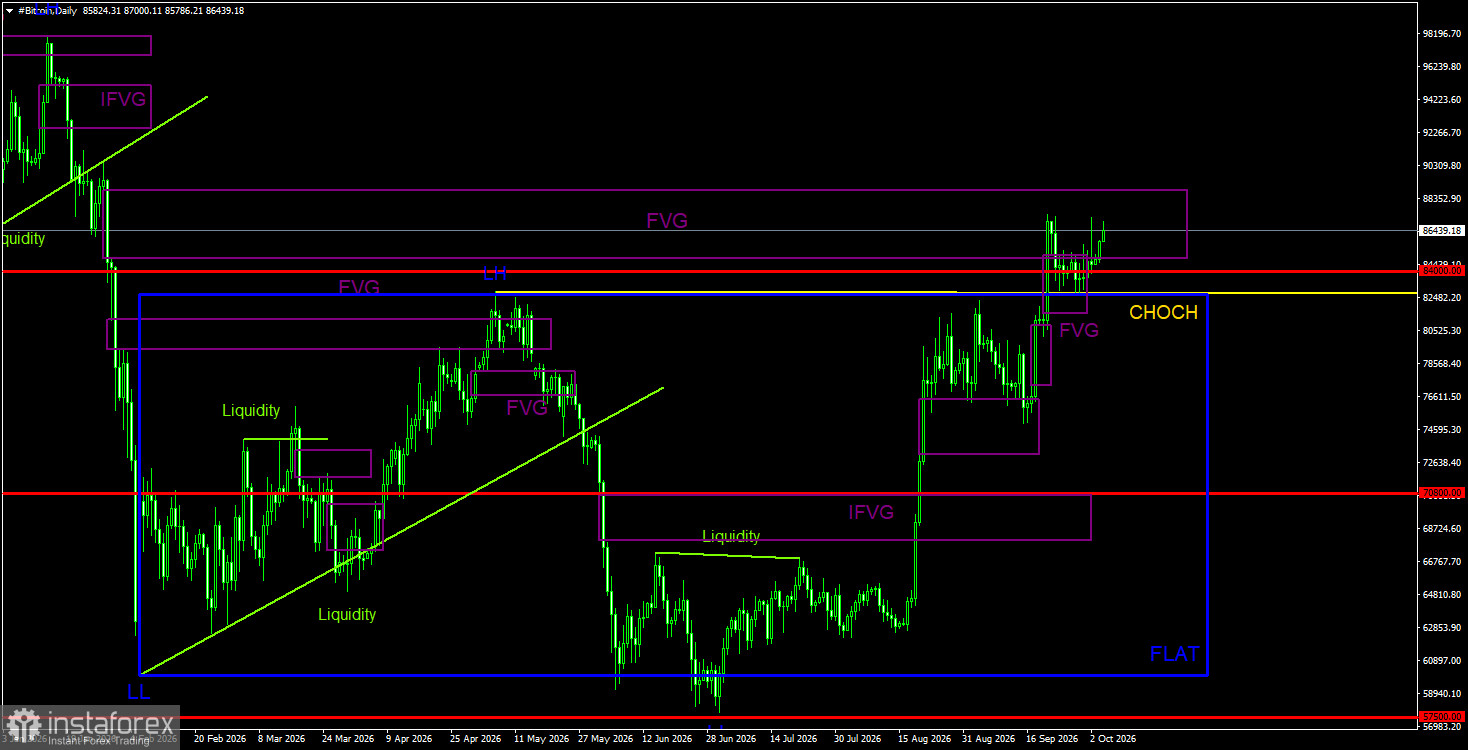
On the daily TF, the downtrend structure is broken, so "digital gold" has most likely moved into a new bull trend. At the moment, the price has filled the previous trend's bearish FVG, so we expect a downward correction. We note that the latest Bitcoin rise, like the mid-August rise, bears all the signs of a pump. The breakout from the $60,000–$82,500 sideways channel may still be a deviation. Support is currently provided by a bullish FVG in the $81,500–$89,000 range; however, so far there has been no reaction to this pattern. Bitcoin is increasingly approaching a correction.
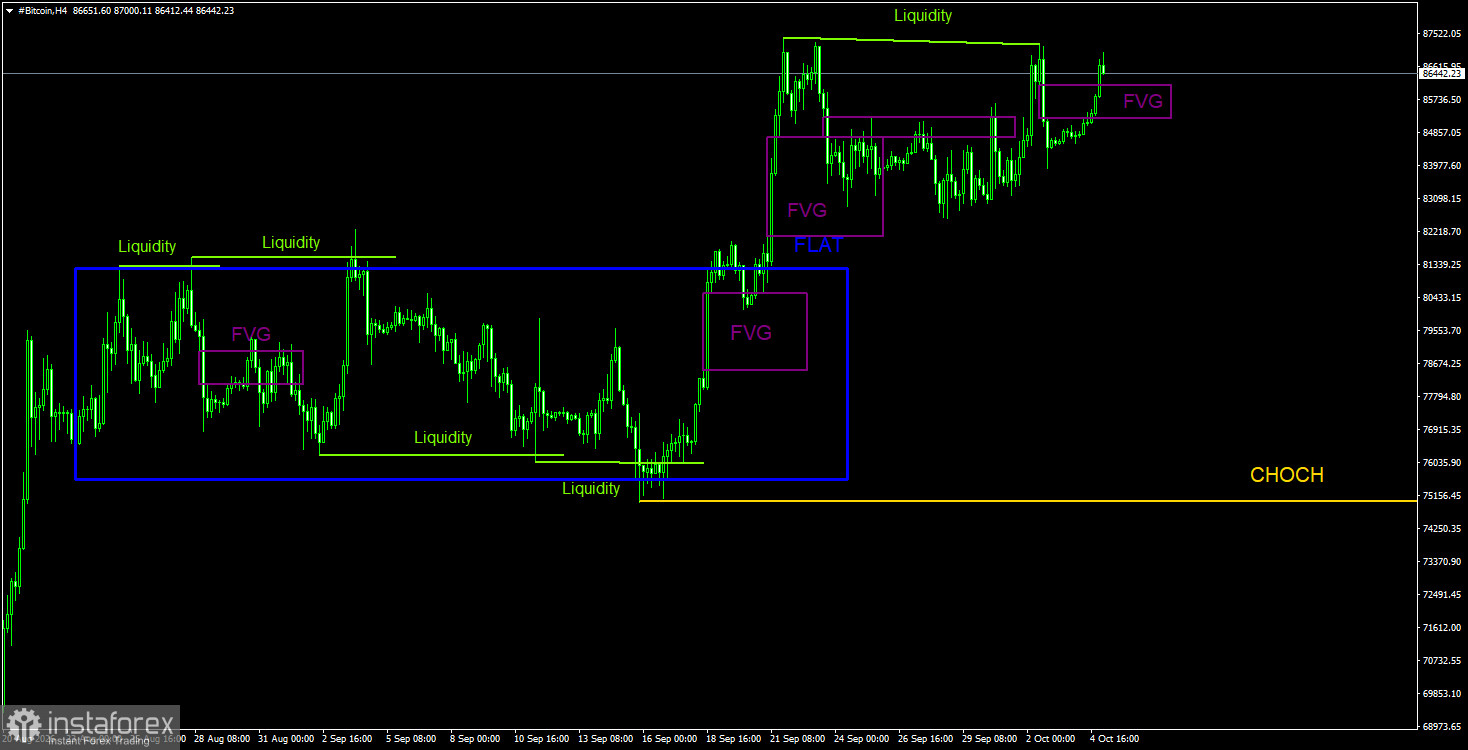
On the 4-hour TF, Bitcoin left the bounds of the sideways channel. Within that channel, four deviations were formed, the last two being "bullish." Thus, traders could have played the final move from the lower boundary of the channel to the upper one, and now we can say the flat is over. We would also note three recent price highs that form a liquidity pool. Before a new decline, the price may collect liquidity from that pool. There are no notable patterns currently, and the last "bearish" FVG was ignored.
Bitcoin shows all the signs of the start of a new bull trend. This trend begins, as usual, with a pump that has no clear reason. The Federal Reserve has not started cutting rates, and the Clarity Act bill has not passed yet. In the near term, on the daily TF, Bitcoin may decline, since the price received a reaction to the bearish FVG. We also draw traders' attention to the fact that the current breakout from the sideways channel on the daily chart may be a deviation — yes, a deep deviation, but still a deviation. If so, Bitcoin can still drop back to $57,500. On the 4-hour TF, one can consider both long and short positions locally, but we still expect a decline.
*这里的市场分析是为了增加您对市场的了解,而不是给出交易的指示。
InstaSpot分析评论将让您充分了解市场趋势! 作为InstaSpot的客户,您将获得大量的免费服务以实现有效的交易。





